Making Big Data Feel Small: Analysis of Hacker News Stories with BigQuery and Ibis (Part 1)
By
M
Marlene MhangamiAuthor(s):
M
Marlene MhangamiPublished: February 1, 2023
11 min read
If you follow my work, you know I love analyzing data sets with open source tools like Ibis. I’m also interested in finding the most efficient ways to access and draw insights from big datasets with Python.
Lately, I’ve noticed an uptick in the Ibis community using Google BigQuery to source large datasets. This inspired me to take a closer look. As a refresher, BigQuery is a Google Cloud product for storing and accessing very large datasets quickly. The BigQuery Public Datasets Program makes useful big datasets available to the general public by storing and hosting them on their platform. One particularly interesting dataset available through the program is the Hacker News dataset; it contains all the stories and comments from Hacker News since its launch in 2006 to present (updated daily)
Hacker News (HN) is a social website focusing on computer science and entrepreneurship. It is estimated that the site attracts more than three million views per day across 300,000+ daily users (source.) For anyone involved in the world of technology, HN is a treasure trove of information and managing to get onto the front page could mean your blog post, product, etc., goes viral. Knowing all of this, I thought it would be helpful to explore the dataset and gather some insights.
A New Approach to Data Analysis
One of the more frustrating parts of using BigQuery for analyzing data is that to access the data you need, you must use SQL. For many data scientists that are accustomed to using Python for data analysis, this can be error prone and make code harder to test.
More recently, I’ve found Ibis is an excellent solution to this problem. Ibis provides a uniform Python interface for a large number of database engines— including BigQuery! In this article, I’ll show you what this looks like by connecting to BigQuery from my local dev environment and analyzing the Hacker News dataset in a Jupyter Notebook. You can find the notebook here if you’d like to access the code to follow along on your own. Let’s get started!
Import the Necessary Libraries
I started by installing ibis-framework and ibis-bigquery, which are the only libraries needed to access data from BigQuery. I then imported Ibis and set interactive mode to True. This makes sure the results of any queries are printed to the console.
python
!pip install --upgrade ibis-framework ibis-bigquery
import ibis
ibis.options.interactive = True
Access the BigQuery API
In order to access the BigQuery API, I created a Google Cloud account and set the correct authorization permissions. Here are the steps I took to do this (images sourced from pypinfo.)
Create project
1 - Go to https://bigquery.cloud.google.com.
2 - Sign up if you haven’t already. The first TB of queried data each month is free. Each additional TB is $5 (USD).
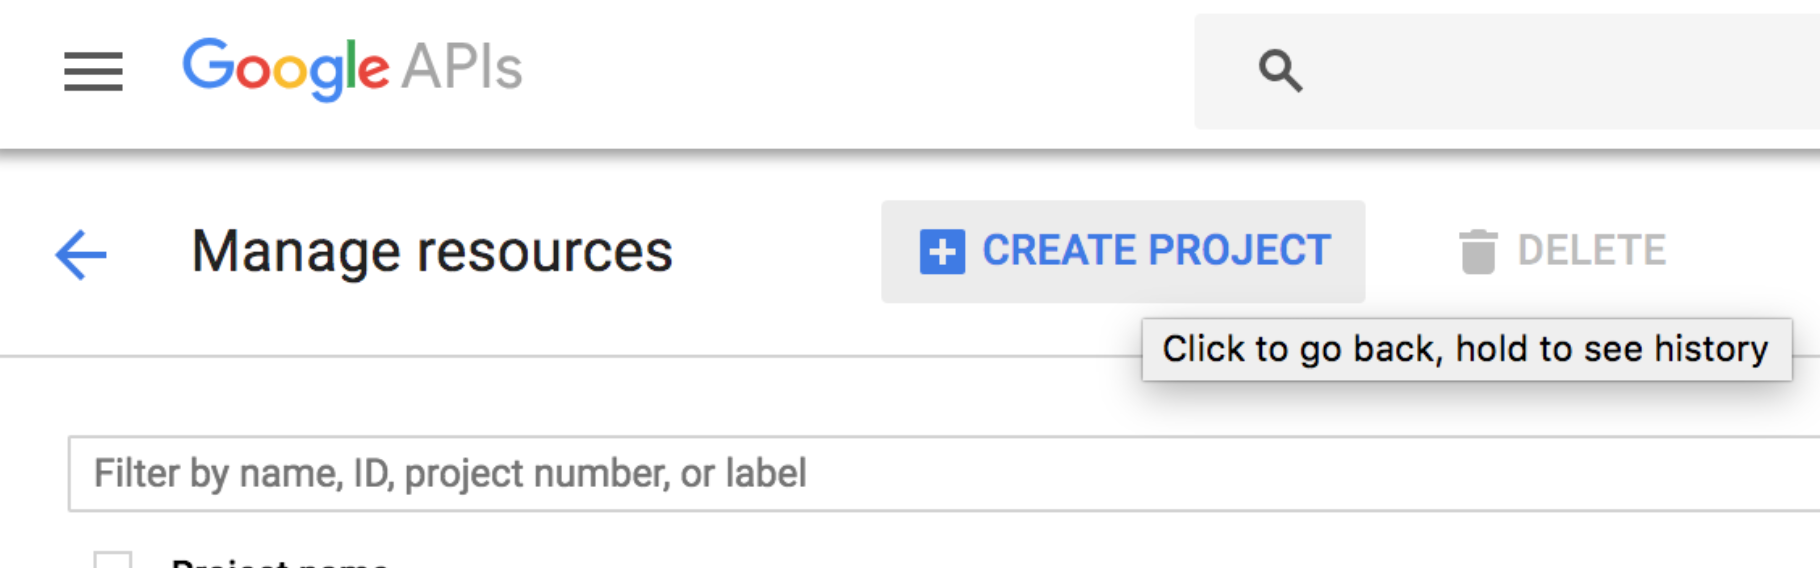
3 - Go to https://console.developers.google.com/cloud-resource-manager
and click CREATE PROJECT if you don’t already have one:
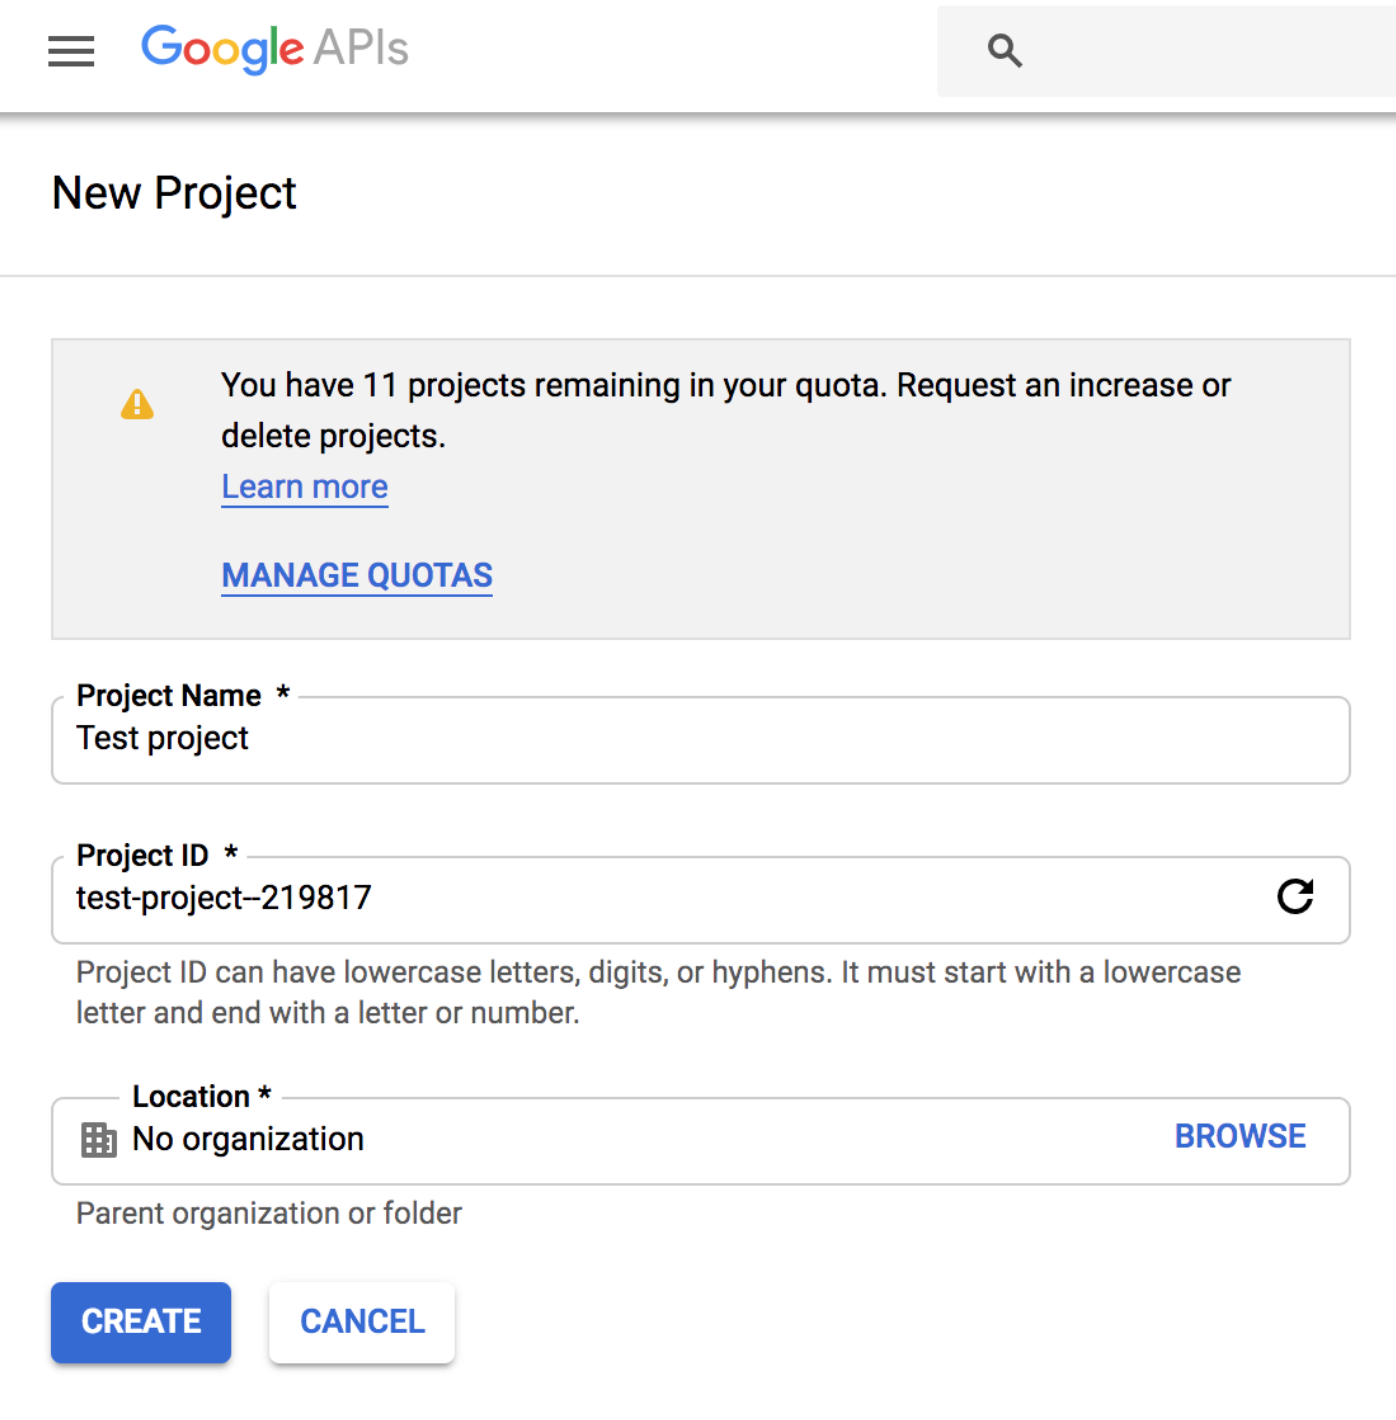
4 - This takes you to https://console.developers.google.com/projectcreate. Fill out the form and click CREATE. Any name is fine, but it’s best to pick a name associated with the project you want to build, for example hacker_news. This way you know what the project is designated for:
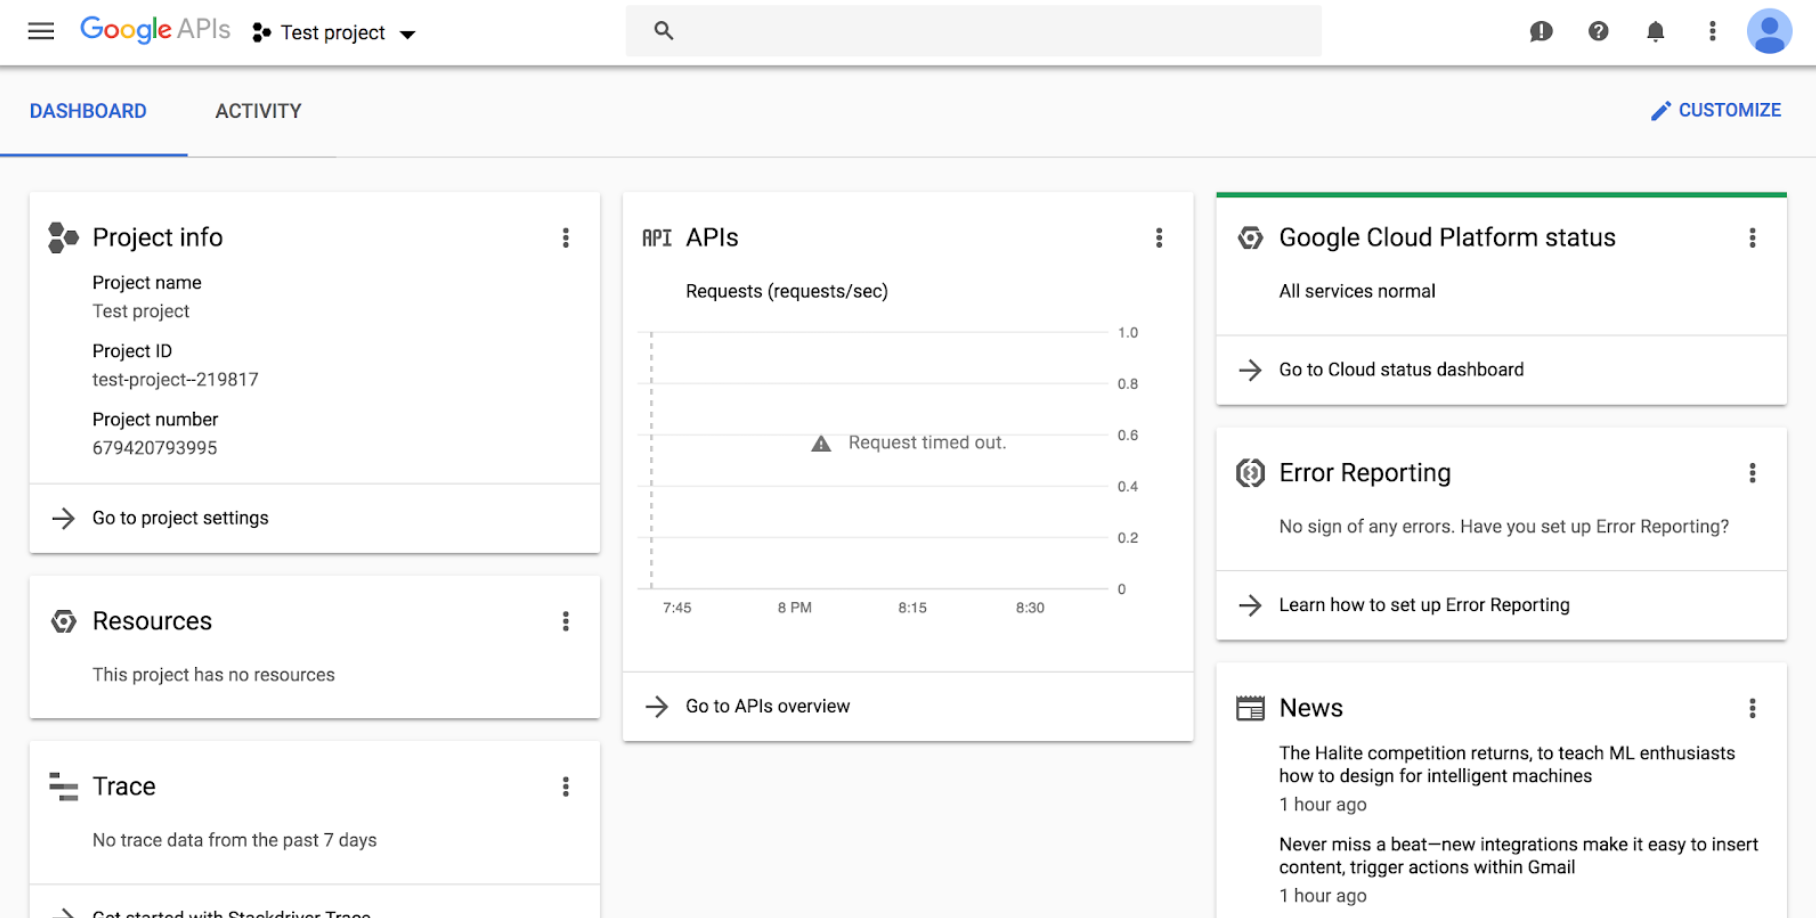
5 - The next page should show your new project. If not, reload the page and select from the top menu:
Enable BigQuery API
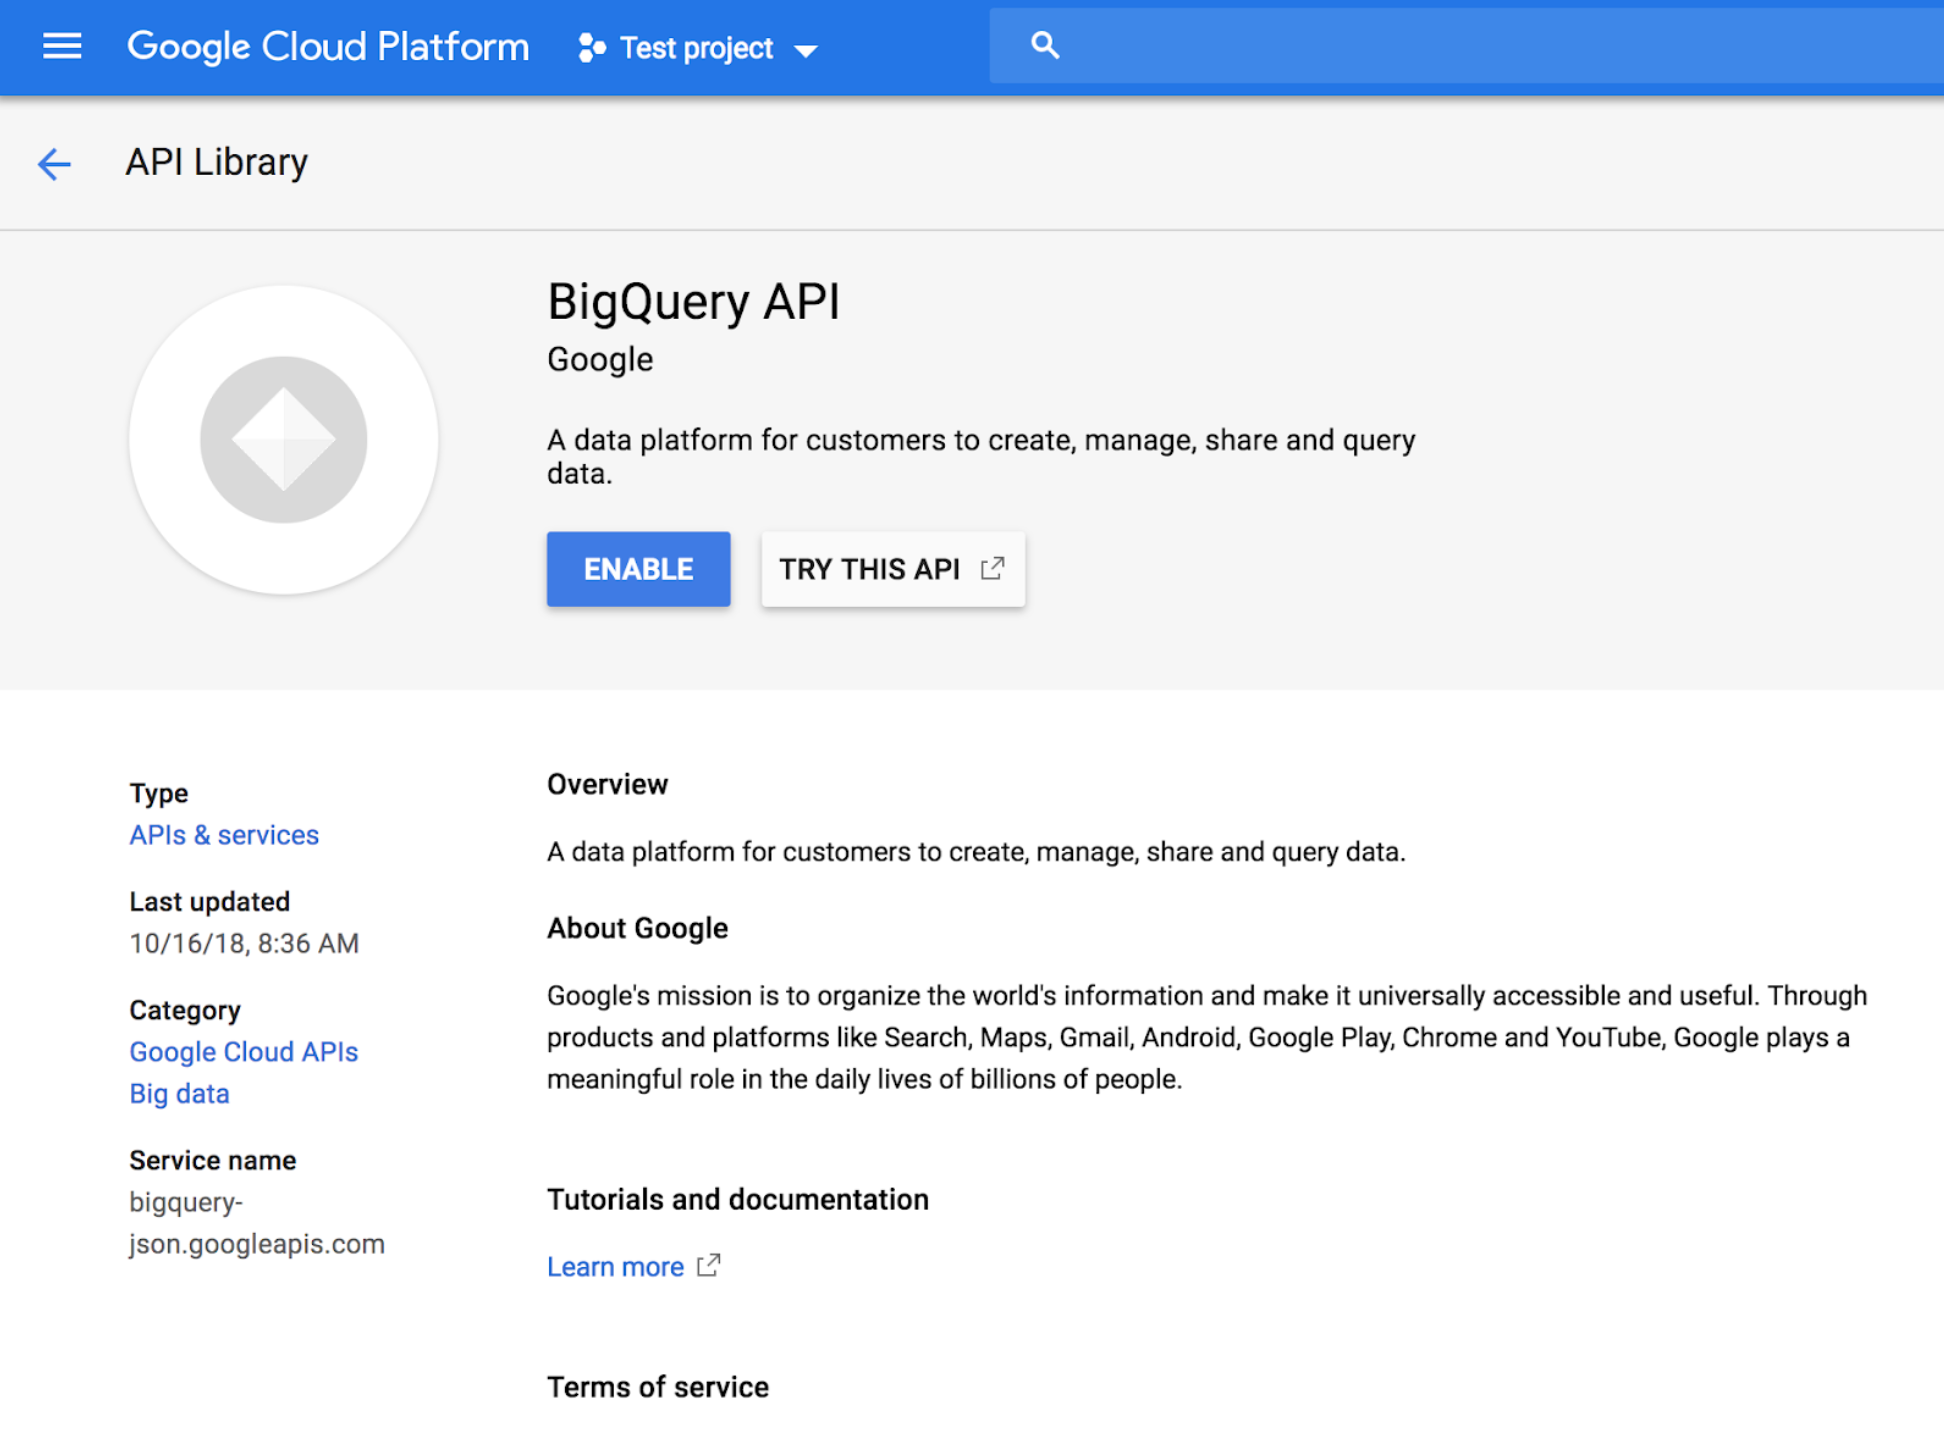
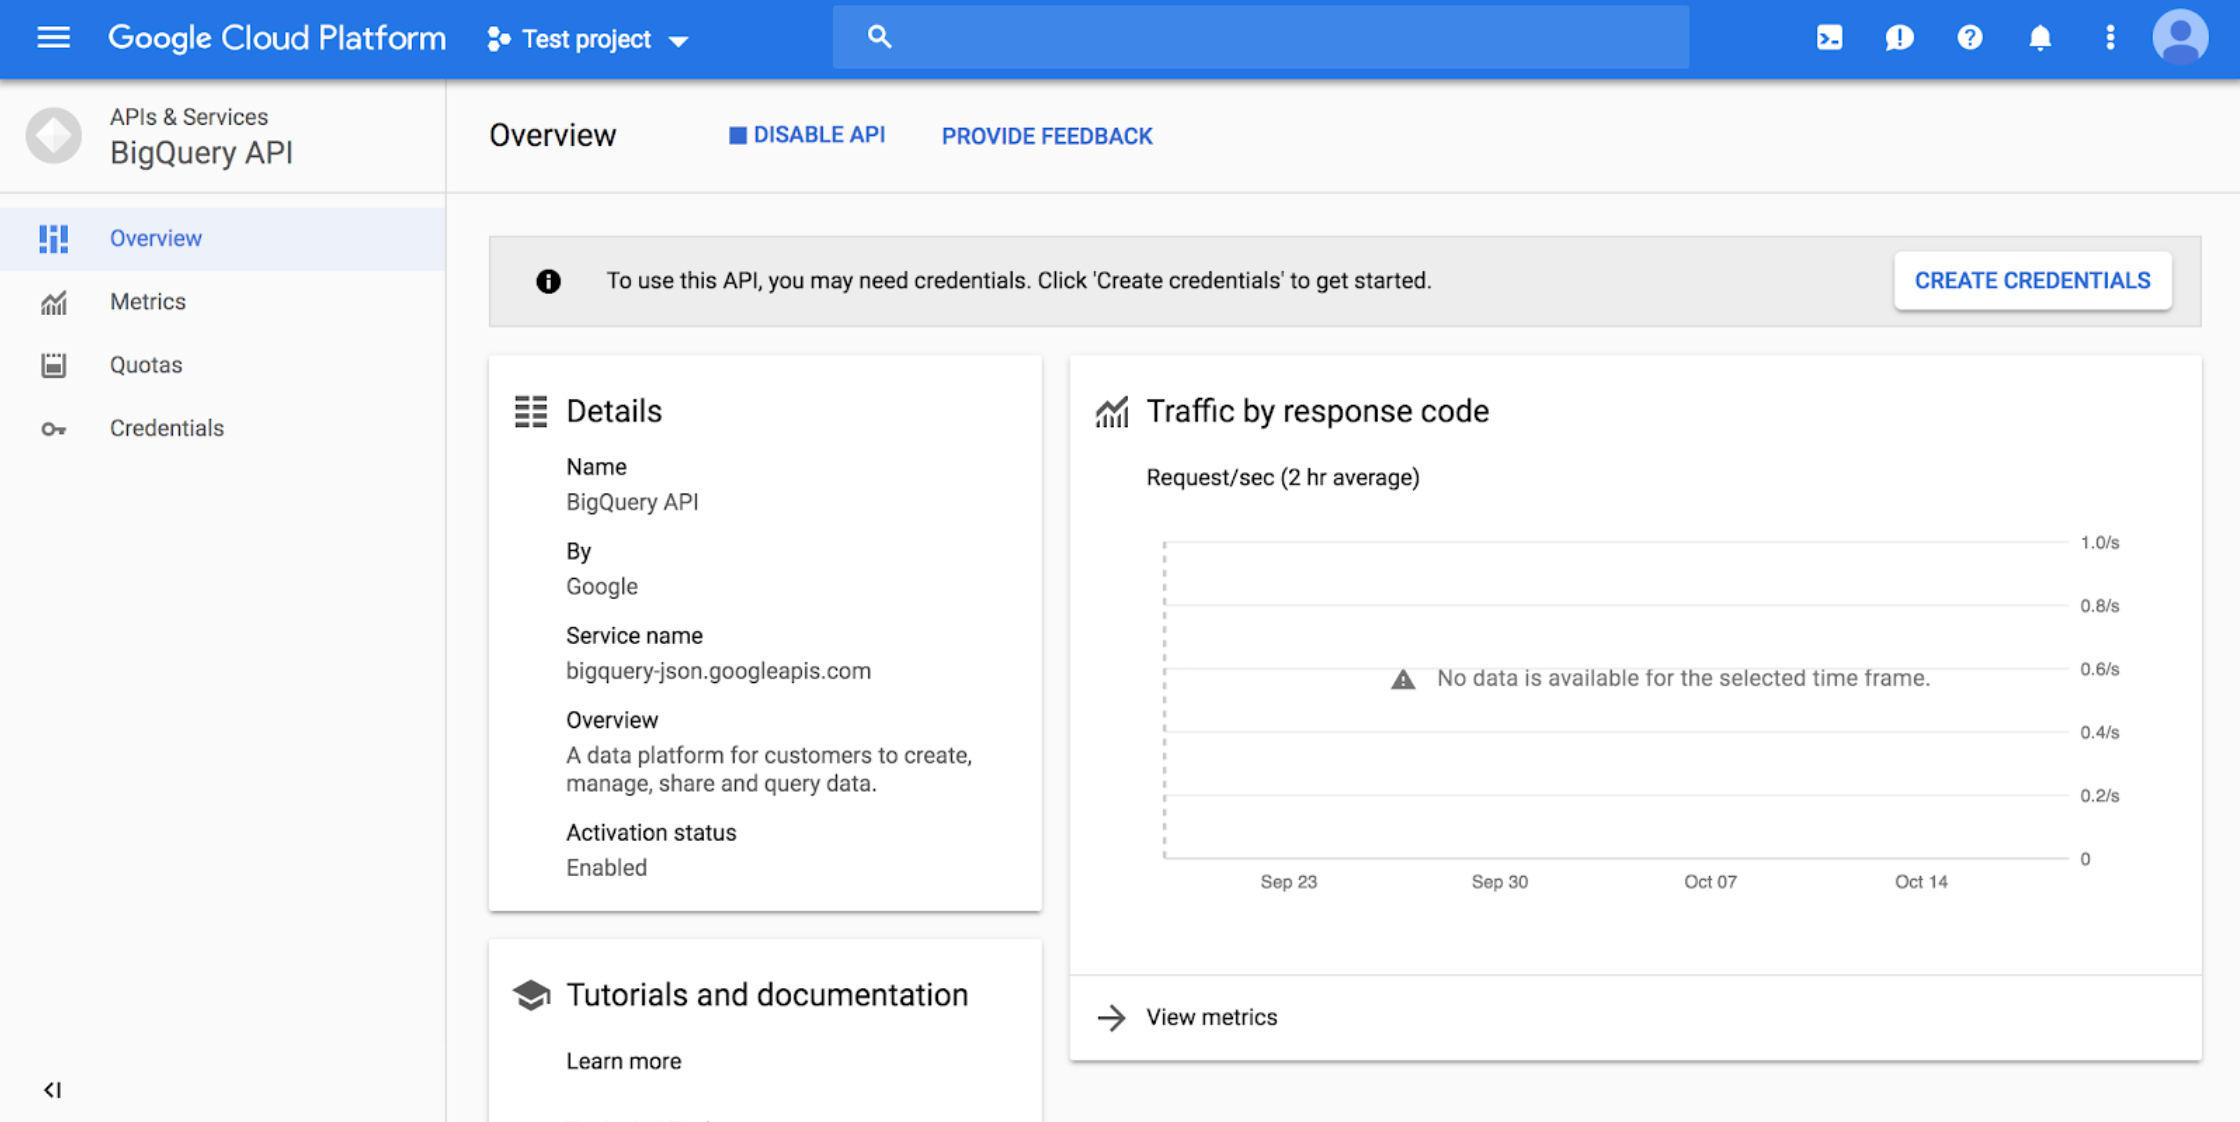
6 - Go to https://console.cloud.google.com/apis/api/bigquery-json.googleapis.com/overview and make sure the correct project is chosen using the drop-down on top. Click the ENABLE button:
7 - After enabling, click CREATE CREDENTIALS:
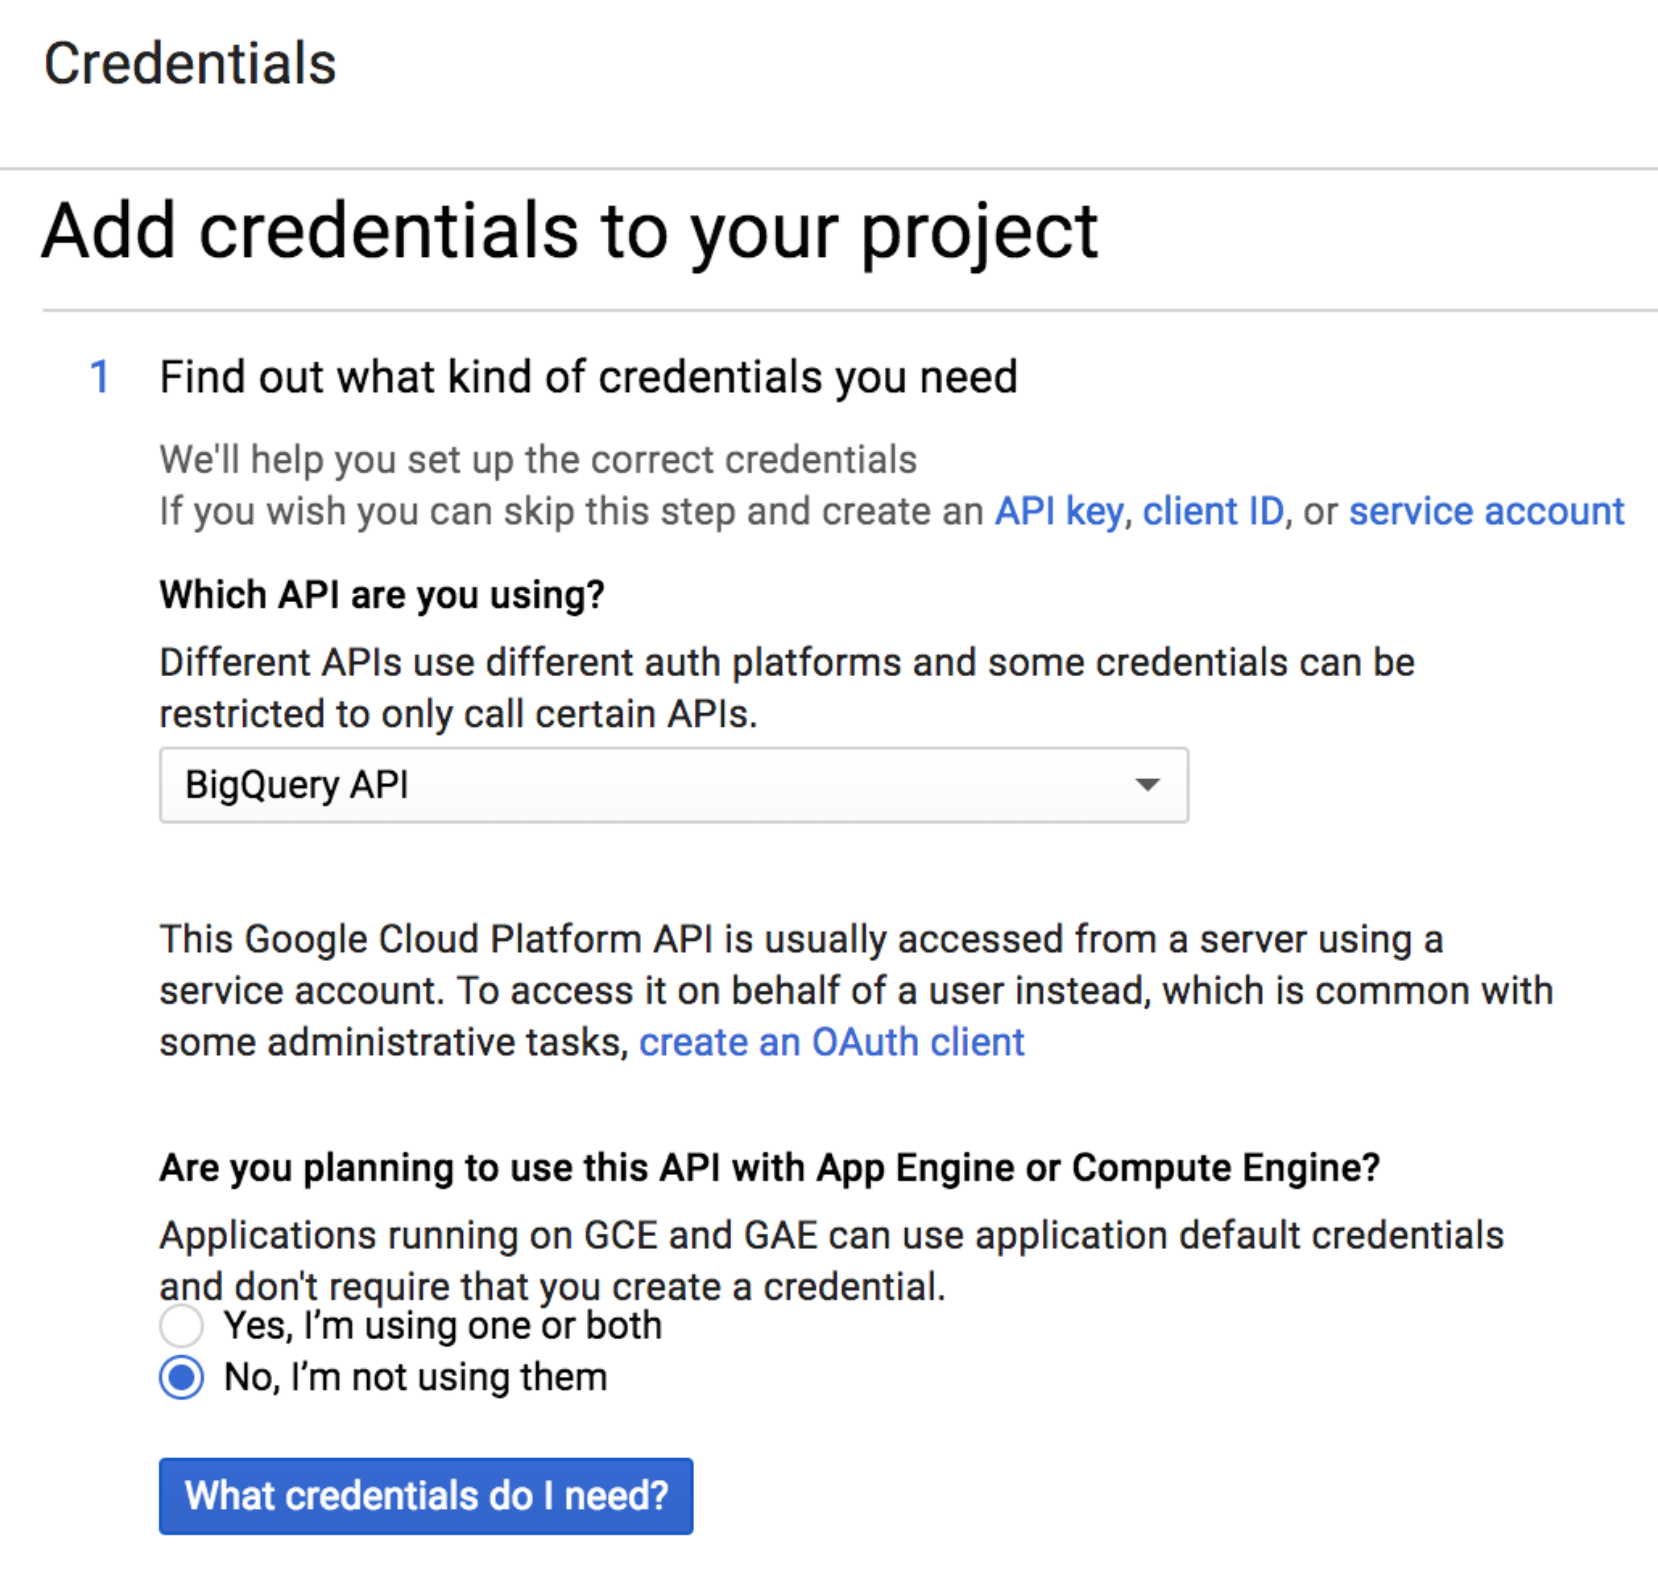
8 - Choose the “BigQuery API” and “No, I’m not using them”:
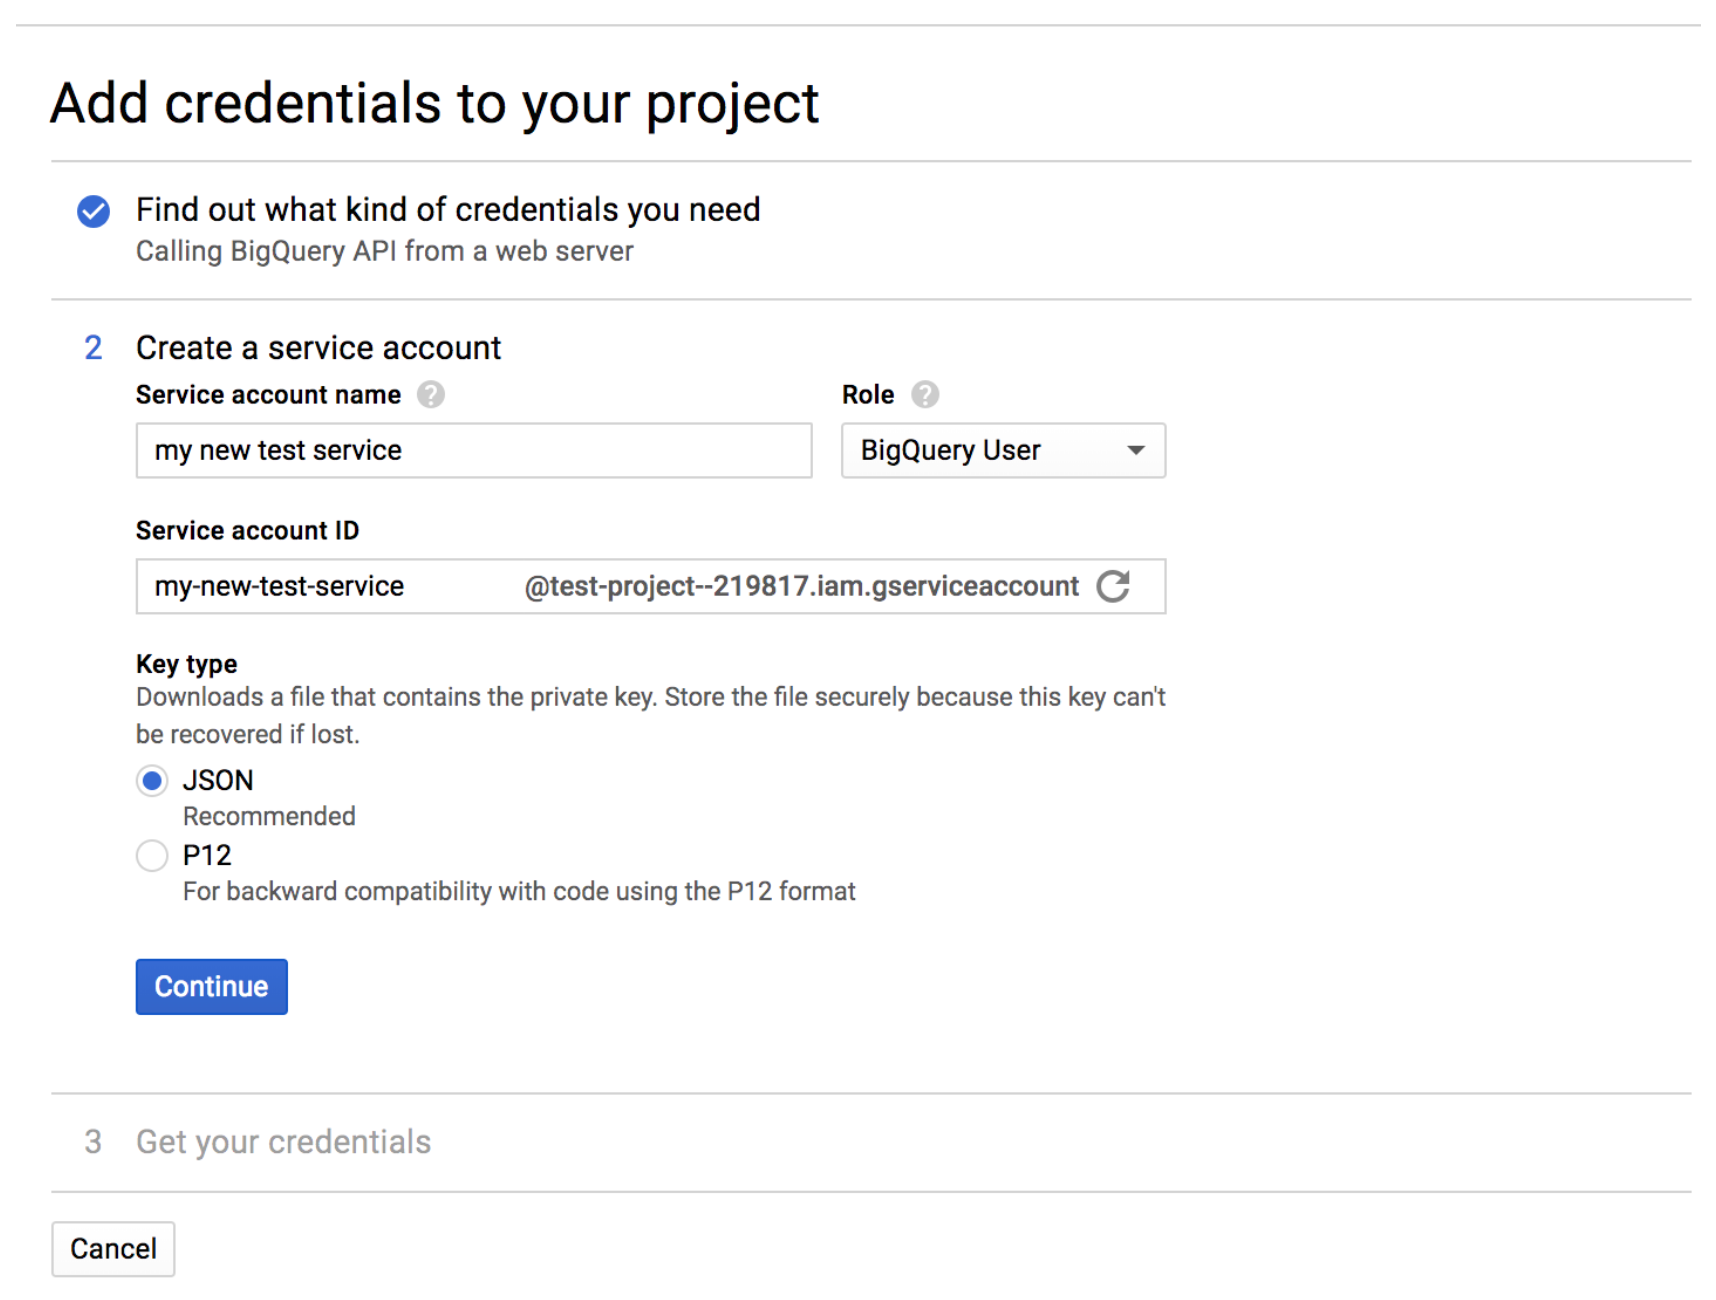
9 - Fill in a name, and select role “BigQuery User” (if the “BigQuery” is not an option in the list,
wait 15-20 minutes and try creating the credentials again), and select a JSON key:
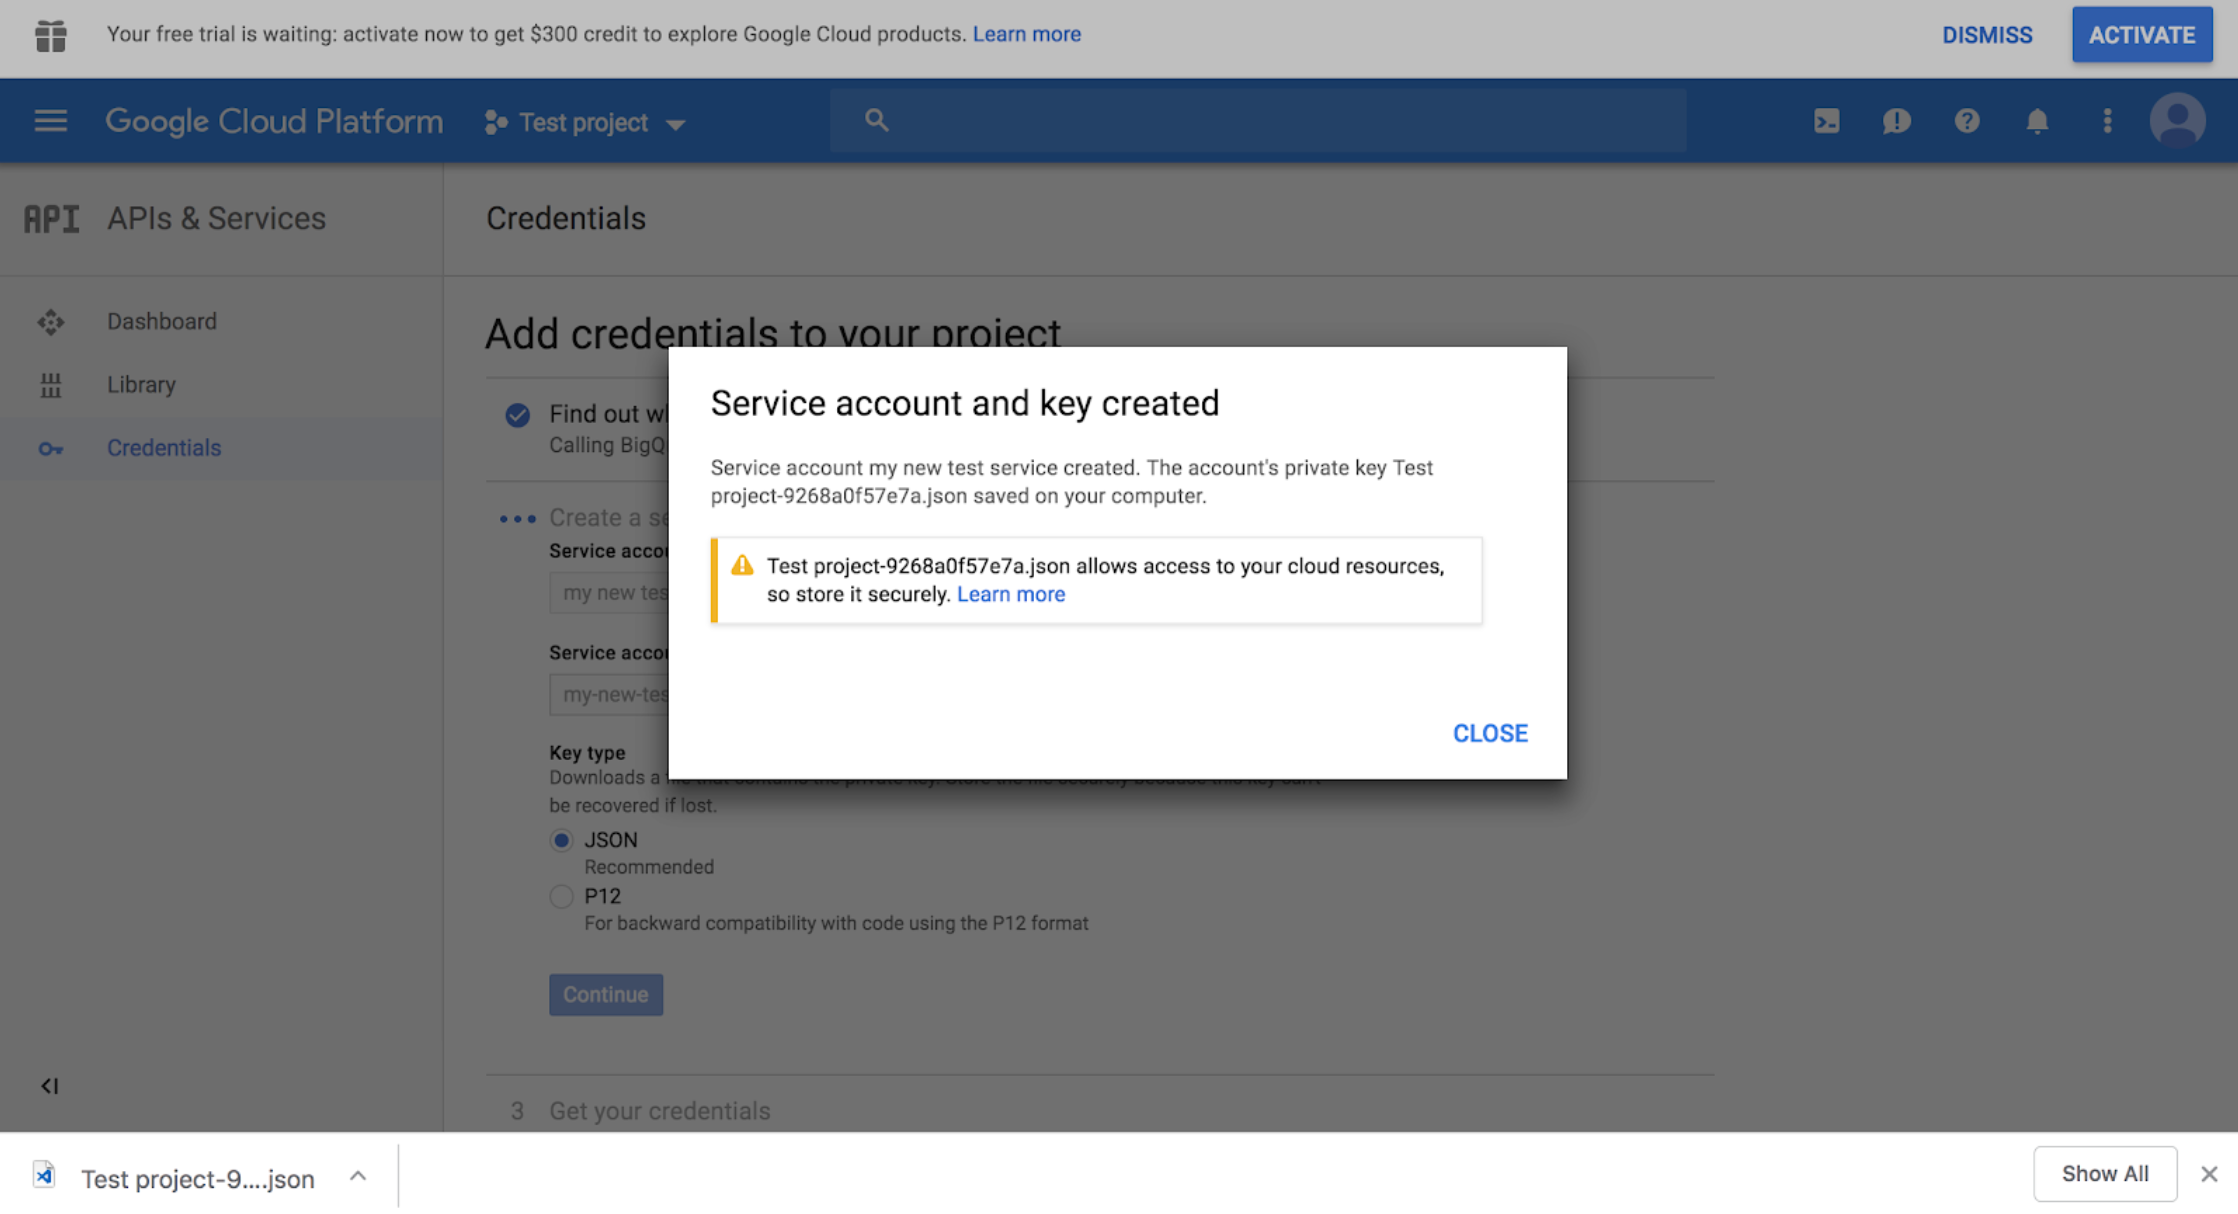
10 - Click continue and the JSON will download to your computer. Note the download location. Move the file wherever you want.
11 - Set an environment variable GOOGLE_APPLICATION_CREDENTIALS that points to the file.
That’s it!
Connect to BigQuery Using Ibis
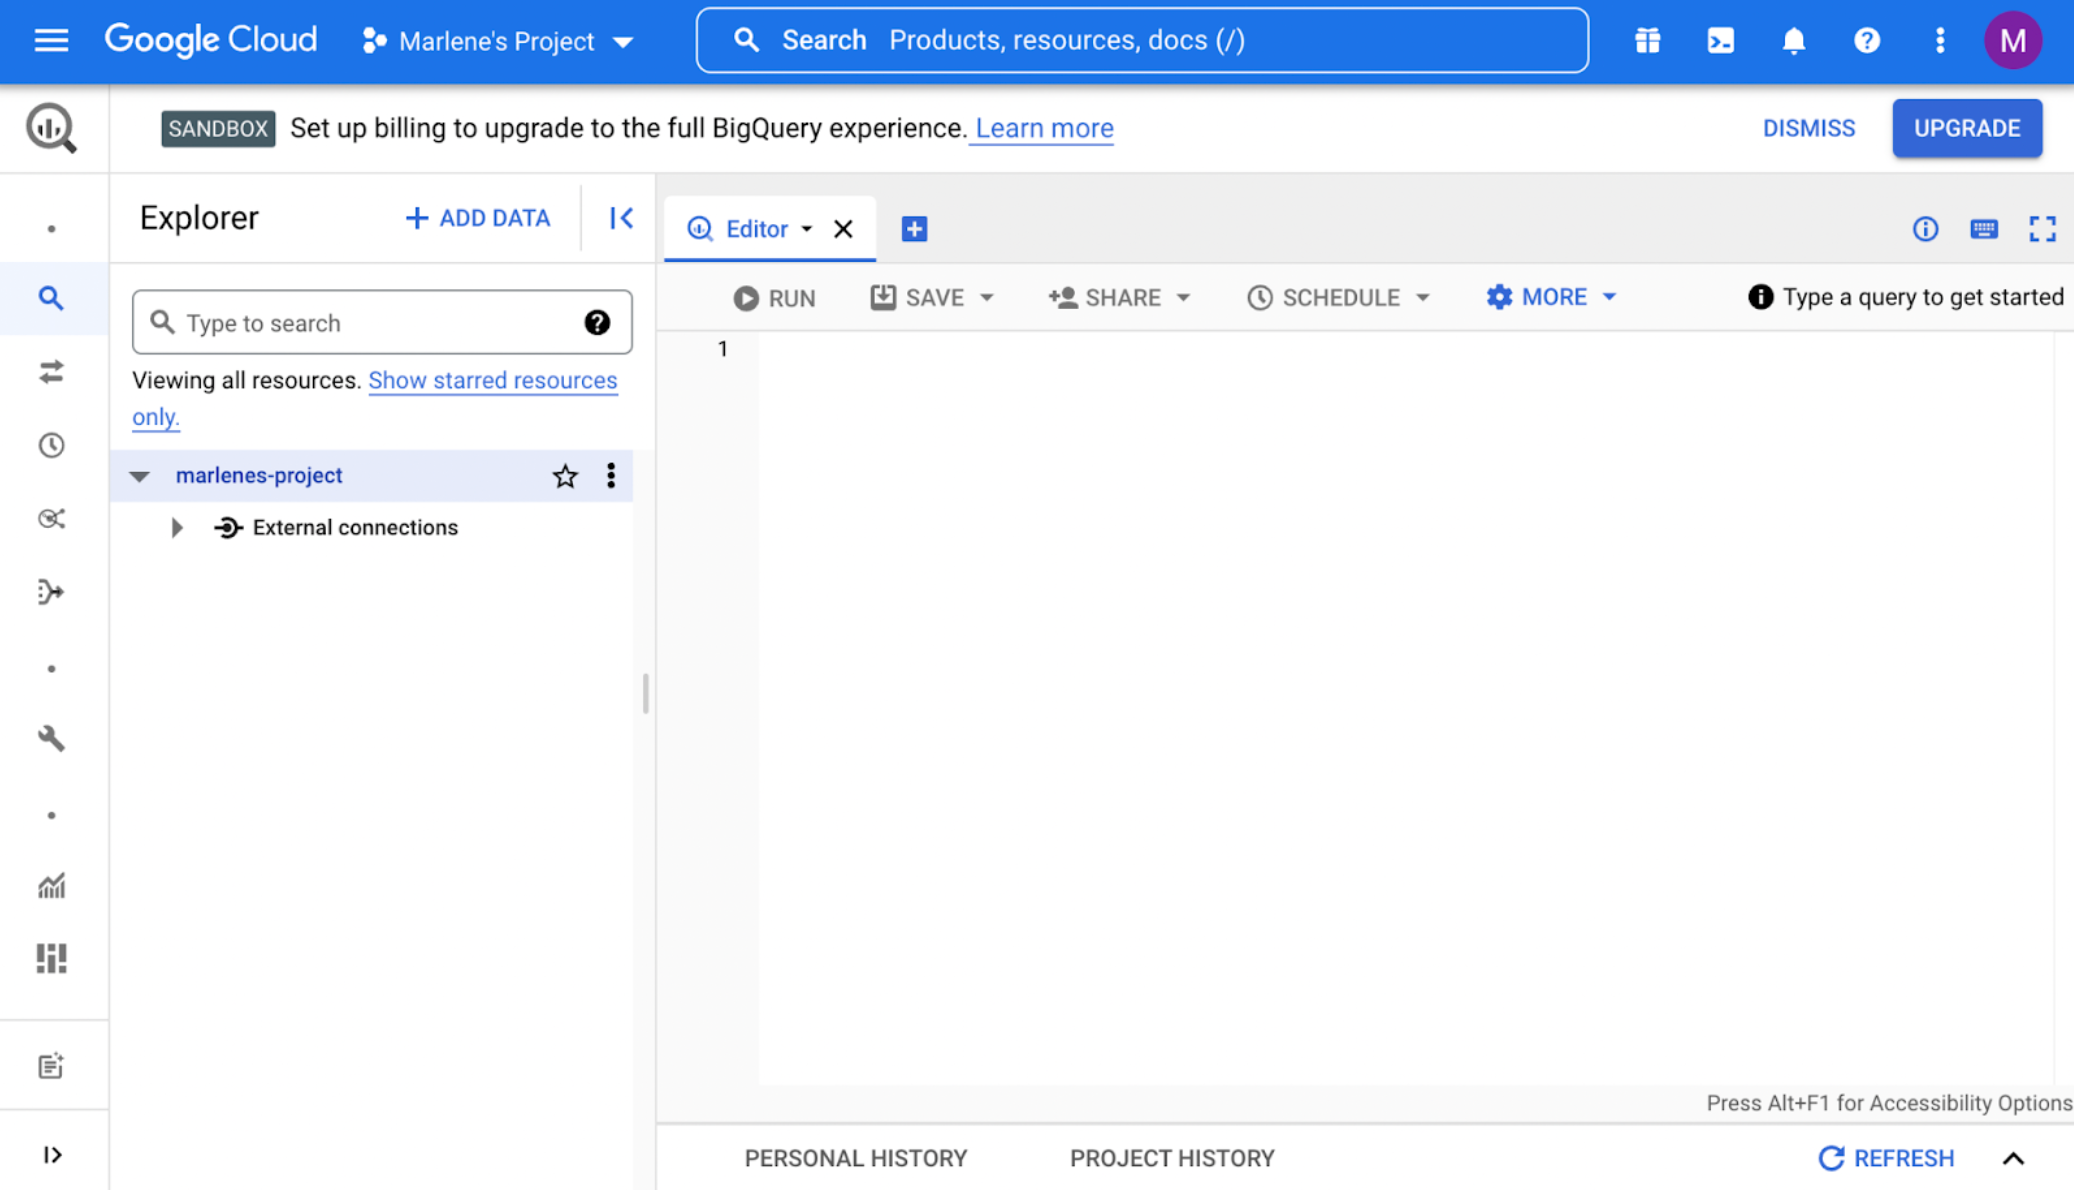
To connect to the Hacker News Dataset, I needed to give Ibis the Project ID I created above in step 4. It’s listed to the left of the Google Cloud Console screen, as seen below, highlighted in blue.
I also needed the Hacker News Dataset ID, which I found here. Using this information, here’s all the code I used to connect to the HN database.
python
hnconn = ibis.bigquery.connect(
project_id = 'your-project'
dataset_id = 'bigquery-public-data.hacker_news'
)
To start to analyze the data, I grabbed the full Hacker News table, containing comments, stories, scores, etc., from the database by running this line of code:
python
full = hnconn.table('full', database='bigquery-public-data.hacker_news')Preview the Dataset
Now that I had access to the table, I wanted to get a better understanding of the data by doing some EDA. To do so I called the head method, in the same way I would with a pandas dataframe.
python
full.head()Here’s what the resulting table looked like:
python
	title	url	text	dead	by	score	time	timestamp	type	id	parent	descendants	ranking	deleted
0	None	None	You've gotta be kidding. 99% of companies…		jonas21		1618596044	2021-04-16 18:00:44	comment	26837146	26832298
1	None	None	At least for tests like the SAT, this is not c…		amznthrowaway5		1618596038	2021-04-16 18:00:38	comment	26837145	26837020
2	None	None	There were VERY early on the podcast revolutio…		ProAm		1618596033	2021-04-16 18:00:33	comment	26837143	26836880
3	None	None	Art is not a commodity; there is no futures tr…		heartbeats		1618596032	2021-04-16 18:00:32	comment	26837142	26830117
4	None	None	>justify why this needs to exist\nwtf justi…		yeetman21		1618596029	2021-04-16 18:00:29	comment	26837141	26835956
I also had a look at how many of each type of submission was in the dataset by running:
python
full.type.value_counts()python
	type	count
0	comment	28897394
1	story	4691514
2	pollopt	13843
3	job	15848
4	poll	2012
Next, I wanted to know what time interval the data was collected in:
python
#find what dates the data spans
years = full.timestamp.year()
print(f'this table shows HN posts from {years.min()} to {years.max()}')
This table shows HN posts from 2006 to 2022
Finally, here’s how many rows are in the table:
python
full.count()
33620611
There are over 33 million rows of data! Since Ibis takes advantage of lazy evaluation, this entire dataset is not loaded into local memory unless I need to use it. This makes it very efficient when working with large datasets like this. To learn more about how Ibis works under the hood, check out my post ‘An Introduction to Ibis for Python Programmers.’
Clean the Data
Next we’ll clean our data, which, in this case, means removing all of the comments that don’t have text in them and all the stories that don’t contain text or a title.
Cleaning the comments
python
#filter the comments and print the number of comments
full_comments = full.filter(full.type == 'comment')
print(f'Before cleaning we had {full_comments.count()} comments')

#clean the comments and print the number of comments after cleaning
clean_comments = full_comments[full_comments['text'].notnull() | full_comments['title'].notnull()]
print(f'After cleaning we have {clean_comments.count()} comments')
Before cleaning we had 28897394 comments ...
After cleaning we have 28050701 comments ...
Cleaning the stories
python
#filter the stories and print the number of stories
full_stories = full.filter(full.type == 'story')
print(f'Before cleaning we had {full_stories.count()} stories')

#clean the stories and print the number of stories after cleaning
clean_stories= full_stories[full_stories['title'].notnull()]
print(f'After cleaning we have {clean_stories.count()} stories')
Before cleaning we had 4691514 comments ...
After cleaning we have 4405643 comments ...
Wrangle the Data
Join the comments and story data
After removing unusable comments and stories, we want to join the comments and story tables so we can better analyze what the comments mean about the story. We’ll carry out some sentiment analysis later on to figure out which kinds of articles got positive comments and which ones did not.
We’ll use the inner join method in Ibis to join the clean stories and clean comments. We can then map the story id to the comment parent id:
python
#join comments and stories
stories_and_comments = clean_stories.inner_join(clean_comments, predicates=clean_stories['id'] == clean_comments['parent'])
Here’s what the full line of code looks like:
stories_and_comments = clean_stories.inner_join(clean_comments,predicates=clean_stories['id'] == clean_comments['parent'])
Now, we’ll choose only the columns we want to use, which in this case are: the story id; the story title; any text accompanying the title on HN; the comment text; and the score the story got.
python
stry_and_cmnts = stories_and_comments[['id_x','title_x','text_x','text_y','score_x']]
stry_and_cmnts
python
id_x title_x text_x text_y score_x
0 741041 Ask HN: Recommended VPS providers Hey guys, I currently have a 2GB server with s… I use SilverRack (<a href=”http://silverrack.c… 1
1 25973061 Ask HN: Backup Android contacts without Google? I've gone through many phones over the ye… Search for a backup and restore app. 1
2 25973061 Ask HN: Backup Android contacts without Google? I've gone through many phones over the ye… <a href=”https://tutanota.com/”… 1
3 7632340 Claim: the comment thread is as fundamental a … Reasoning: an essay is a path/list of ide… Yes, uncontroversial, unless and until you try… 1
4 13739569 The Social, Dating and Blogging Website Come and join our wonderful community of aweso… Dating sites should have areas where you can s… 1
… … … … … …
9995 8577513 Google Blacklist – Words That Google Instant D… None There's a similar list (or was in 2010&#x… 110
9996 8577513 Google Blacklist – Words That Google Instant D… None ball sack, ball kicking, ball gravy. These are… 110
9997 8577513 Google Blacklist – Words That Google Instant D… None Mmmh… Not getting a whole lot of hits on the… 110
9998 8577513 Google Blacklist – Words That Google Instant D… None All I got from this is Bill is really into but… 110
9999 8577513 Google Blacklist – Words That Google Instant D… None A ton of these worked for me. 11010000 rows x 5 columns
Then we’ll run a groupby to find how many comments each story has.
python
num_comments = stry_and_cmnts.text_y.count()
stories_grouped = stry_and_cmnts.group_by('title_x').aggregate(comments=num_comments)

stories_grouped
python
	title_x	comments
0	Ask HN: Learn Math the Hard Way	36
1	Ask HN: How to prepare for a Front-end Develop…	37
2	The secrets of body language	28
3	“My wife has complained that OpenOffice will n…	74
4	Ask HN: Getting started in biology with a soft…	34
…	…	…
9995	Firefox Can Now Get Push Notifications from Yo…	23
9996	Firefly III: A free and open-source finance ma…	23
9997	An Open Letter from the CEO of Puppet: Puppet …	23
9998	Inkdrop – Notebook app for Hackers	23
9999	Why to use a static site generator instead of …	23
10000 rows x 2 columns
At this point, I’m also a bit curious about how many stories we’re dealing with, so we’ll check that:
python
stories_grouped_numbers = stories_grouped.aggregate(comments=num_comments)
stories_grouped_numbers.count()
Great, it looks like we’re working with over one million stories!
Analyzing the data
Next, let’s have a closer look at some things the data tells us. We’ll start by finding out what score a story has to have to be considered good, average, or not so good. Note that we’ll determine this statistically.
The lowest score a story could have is:
python
min_score = stry_and_cmnts.score_x.min()
min_score
-1
The highest score a story so far has attained:
python
max_score = stry_and_cmnts.score_x.max()
max_score
6015
For a story to be considered “average” it should have a score of about 185 like we can see below:
python
avg_score= stry_and_cmnts.score_x.mean()
avg_score
185.62919906694896
What Are People Writing About on HN?
Most Popular Stories
To help us begin to understand which stories are the most popular on HN, let’s take the titles and arrange them in descending order based on their score.
python
titles = stry_and_cmnts[['id_x','title_x', 'score_x']].distinct()
sorted_titles = titles.sort_by(ibis.desc('score_x'))
sorted_titles
python
	id_x	title_x	score_x
0	16582136	Stephen Hawking has died	6015
1	11116274	A Message to Our Customers	5771
2	3078128	Steve Jobs has passed away.	4338
3	31261533	Mechanical Watch	4298
4	24872911	YouTube-dl has received a DMCA takedown from RIAA	4240
…	…	…	…
9995	9657271	Tmux has left SourceForge	504
9996	16738016	UN: Facebook has turned into a beast in Myanmar	504
9997	25159097	PostgREST: REST API for any Postgres database	504
9998	8424696	Adobe Spyware Reveals Again the Price of DRM: …	504
9999	16222478	ActivityPub: decentralized social networking p…	504
10000 rows x 3 columns
The top story is about the passing of Stephan Hawking, certainly worth its position. I wanted to see a little more context about the second story, “A Message to Our Customers”, so I pulled its details from the full stry_and_cmnts table I made earlier to check if I could learn more.
python
stry_popular = stry_and_cmnts[stry_and_cmnts.id_x == 11116274]
stry_popular
python
id_x title_x text_x text_y score_x
0 11116274 A Message to Our Customers None I am happy AAPL is taking this stance. But I c… 5771
1 11116274 A Message to Our Customers None Dear Tim Cook,<p>Thank you! 5771
2 11116274 A Message to Our Customers None "In the wrong hands, this software — whic… 5771
3 11116274 A Message to Our Customers None If the UK record on anti-terror scope creep is… 5771
4 11116274 A Message to Our Customers None So the FBI is asking Apple to build a tool tha… 5771
… … … … … …
208 11116274 A Message to Our Customers None I think there are two orthogonal questions:<p>… 5771
209 11116274 A Message to Our Customers None A phone without a backdoor would be illegal in… 5771
210 11116274 A Message to Our Customers None The numerical passcode is likely his ATM pin, … 5771
211 11116274 A Message to Our Customers None While we believe the FBI’s int... 5771
212 11116274 A Message to Our Customers None Tim found dead under mysterious circumstances … 5771213 rows x 5 columns
Unfortunately, even though this story has a title, there was no summary text uploaded to HN. However, there were a bunch of comments that all have something to do with Apple. Looks like something to do with the FBI and passcodes, etc… Interesting!
Most Common Topics
I also wanted to know which topics or words appear the most on HN. To do this I used the natural language processing module from SpaCy to parse out the most defining word from each title. I also needed to use a function I created on my own (a User Defined Function, or “UDF”) that took each title from the ‘title_x’ column and returned the main entity of the sentence. Here’s what that function looked like:
python
import spacy
nlp = spacy.load("en_core_web_sm")


def find_entity(title):
   parsed_title = nlp(title)
   entity_arr = []
   for num, entity in enumerate(parsed_title.ents):
       entity_arr.append(entity.text)
   return  ' '.join(entity_arr)
Unfortunately, Ibis does not provide full support for user defined functions, yet — but to get around this, I can call execute on the sorted titles column to return a pandas Series.
Here’s how that works: since Ibis uses lazy evaluation sorted_titles[“title_x”] is an Ibis expression that isn’t actually pulling any data into memory. Like I mentioned earlier, this is very efficient and, for the most, it’s what’s been happening before this point. Once I explicitly call execute Ibis knows to load the specified columns into memory and returns the result as a pandas dataframe. We can then use the pandas apply function on it to use our UDF.
This isn’t quite as efficient, but allowed me to apply my UDF and I’m able to switch right back to an Ibis table once that’s done! This is also better in terms of efficiency than if we had just used a pandas dataframe from the start. We are only pulling the sorted title names into memory and not all 33 million rows.
Here’s the code I used to return the sorted titles column as a pandas Series:
python
new_table = sorted_titles["title_x"].execute()


#this is a pandas dataframe
type(new_table)
pandas.core.series.Series
Here’s the code to apply the find_entity function I made above:
python
entity_col = new_table.apply(find_entity)Next I wanted to get the value count of each entity and plot this out. I also limited the results to the top 24 entities.
python
top_entities = entity_col.value_counts()
top_entities = top_entities[1:25:]
Lets preview this table:
python
top_entitiespython
title_x	int64
Google	138
Apple	49
Amazon	44
GitHub	34
YouTube	31
Facebook	28
2018	25
Twitter	22
US	22
Microsoft	22
one	19
2017	19
2016	19
JavaScript	17
2020	17
EU	16
U.S.	16
CSS	16
2014	14
Android	14
Hacker News	13
One	12
Chrome	12
2	11
Name: title_x, dtype: int64
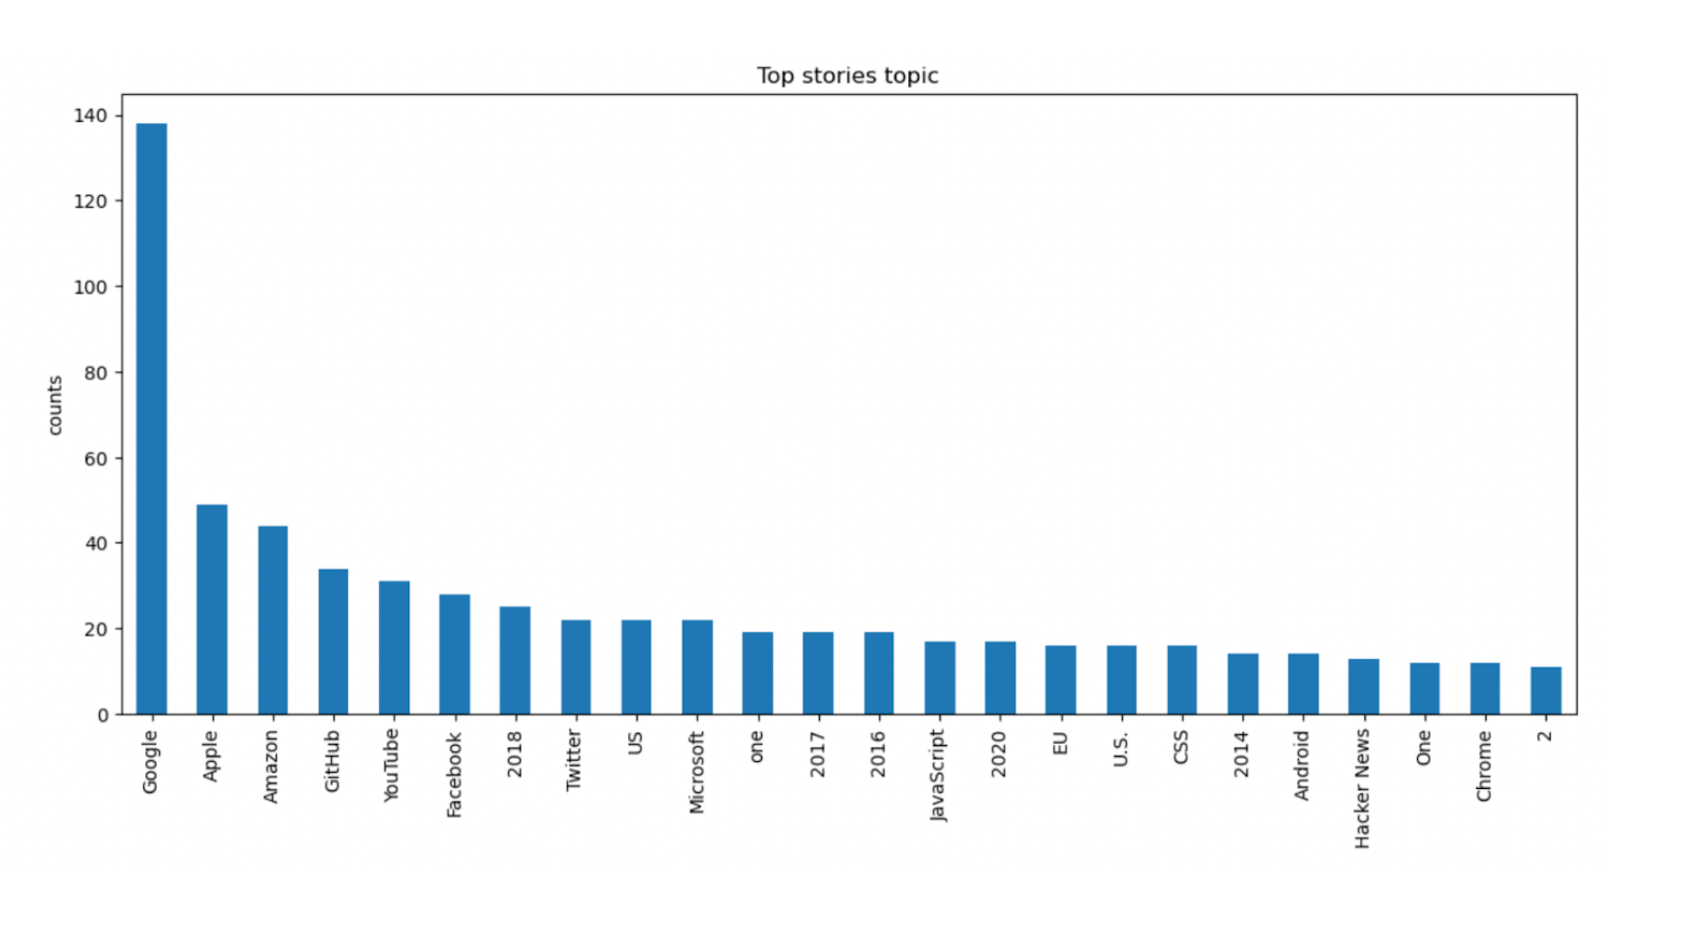
Great! To visualize the results better I decided to use matplotlib to plot a graph of the words or phrases that appear the most.
python
import matplotlib.pyplot as plt
top_entities.plot(x="entity",y=["counts"],
                    kind="bar",figsize=(14,6),
                    title='Top stories topic').set_ylabel("counts")
Text(0, 0.5, 'counts')
I then made a word cloud to help visualize this even more:
python
from wordcloud import WordCloud
cloud = WordCloud(width=1440, height= 1080,max_words= 200).generate_from_frequencies(top_entities)
plt.figure(figsize=(20, 15))
plt.imshow(cloud)
plt.axis('off');
plt.show()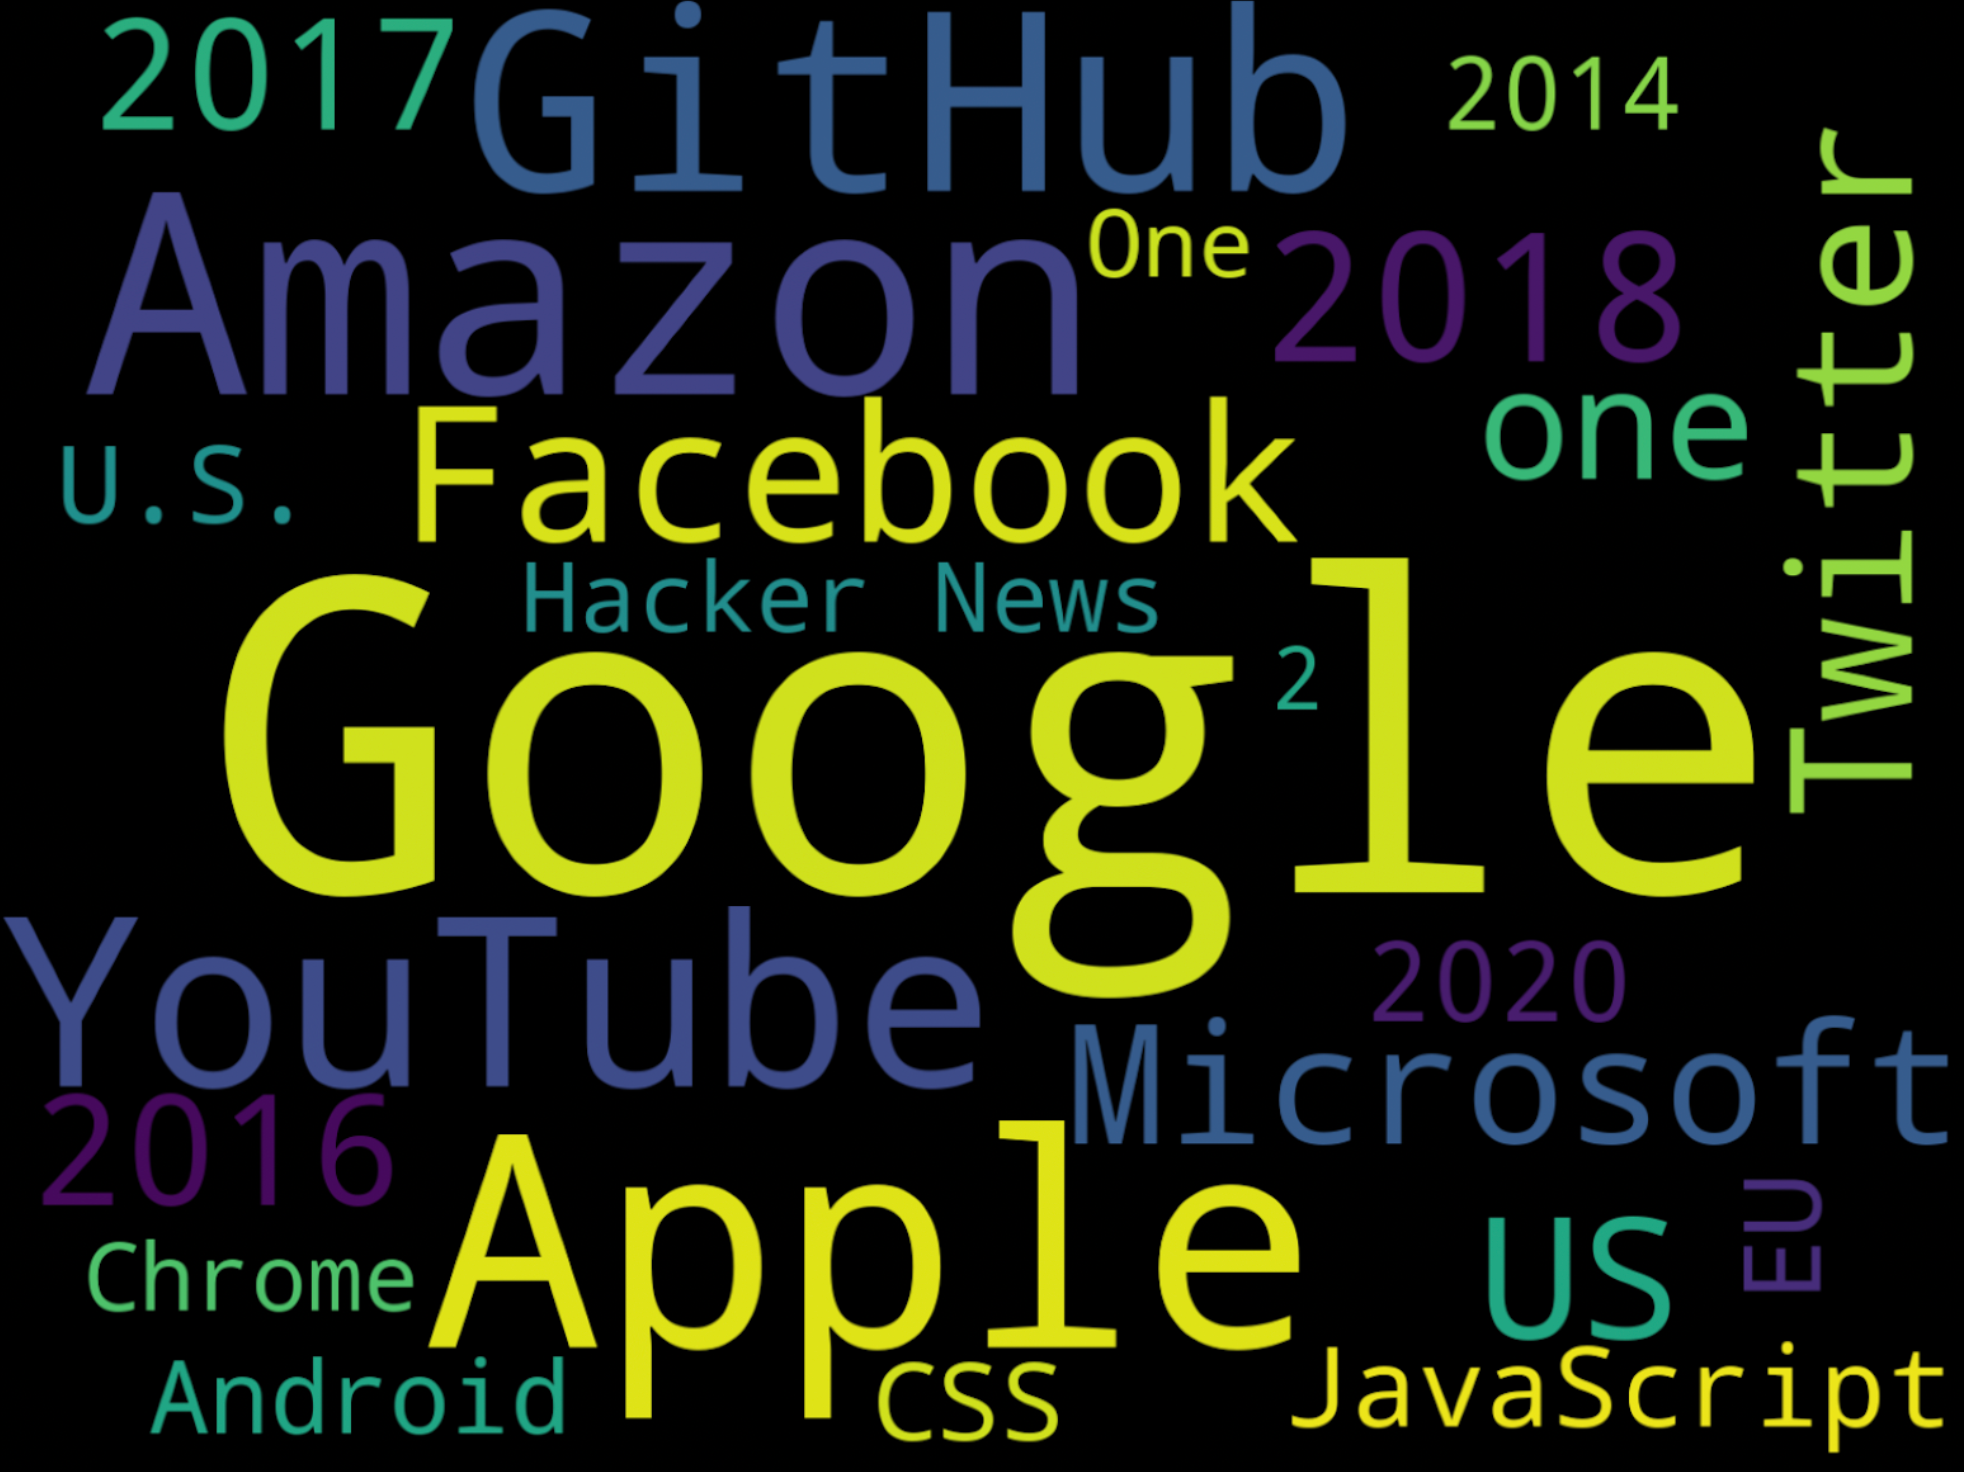
Google is by far the most mentioned entity followed by Apple, Amazon, and GitHub, with YouTube and Facebook not far behind. This seems to corroborate what we know about FAANG (Facebook, Apple, Amazon, Netflix, and Google) being some of the most popular companies in tech.
To keep working with the data in the most efficient way possible, I converted the top_entities pandas table back into an Ibis table using the following line of code:
python
top_entities = ibis.memtable(top_entities)

type(top_entities)
ibis.expr.types.relations.Table
Using Ibis, I’ve already been able to draw out some insights from our BigQuery dataset! I’d still like to run some sentiment analysis on the data to figure out what kind of posts have negative comments and which posts tend to get good ones. I’ll share the steps for this in a Part 2 blog. In the meantime, you can test out the code using the Jupyter notebook here. Voltron Data offers support for developers and enterprises working with Ibis. If you’re interested in learning more, check out our subscription options.
Previous Article

Keep up with us