How Polars Leverages Rust and Arrow For Faster Data Pipelines
By
M
Marlene MhangamiAuthor(s):
M
Marlene MhangamiPublished: July 14, 2023
8 min read
I recently had the amazing opportunity to attend three Python conferences around the world: PyCon US, PyCon Lithuania, and PyCon Italia. For me, attending these conferences felt like looking through a window into the fast-approaching future of the language and its community. One of the trends that I was surprised to notice was the increased interest and adoption of Rust. ‘Rust for Pythonistas’, ‘Writing Python extensions in Rust’, ‘How Pydantic V2 leverages Rust’s Superpowers’, and ‘Robyn: An async Python web framework with a Rust runtime’ are just a few of the talks that were given on the subject. Beyond feeling the need to drop everything and learn a new language, I found myself drawn to the topic and now believe Python and Rust go together beautifully.
One talk in particular that stood out was by Ritchie Vink, the creator of Polars. His talk was titled ‘Polars: done the fast, now the scale’ and looked at what Polars has achieved since its inception and what’s in its future. Polars is a relatively new dataframe library that has been gaining traction (earlier this year, we highlighted it as a open source project to watch in 2023!). It was designed by Ritchie from the ground up and though it is written completely in Rust, you can still use it with Python. Voltron Data contributes significantly to the Arrow ecosystem and so another reason this talk caught my eye is because Polars also uses the power of Arrow for efficient data representation and sharing. This post will be an introduction to Polars, covering what it does, how it does it, and how to integrate it with other tools you love using Ibis.
What Problem is Polars Solving?
Polars tries to address the limitations and inefficiencies of existing dataframe libraries. When we take a look at the current dataframe implementations in Python, many of them have not fully embraced the decades of research and design in relational databases. This means they lack important optimizations, resulting in unnecessary memory usage and slower performance, especially when dealing with big data. This inefficiency is made worse by the fact that most users are not data or query optimization experts, so they end up writing code that’s not as memory-efficient or fast as it could be.
Some of the dependencies that legacy dataframe libraries use can lead to these pitfalls. One example is NumPy, which is great for numerical computations, but not always as efficient for relational operations. A specific case is that NumPy doesn’t handle missing data well, leading to ambiguous representations. Also, when it comes to strings, the current solutions are inefficient, making it a hassle to work with string data. Beyond this, as we come to the end of Moore’s Law, single-threaded code is becoming a limitation and computers now come with multiple cores that existing tools often don’t take full advantage of. Polars is built in an effort to solve all of these problems.
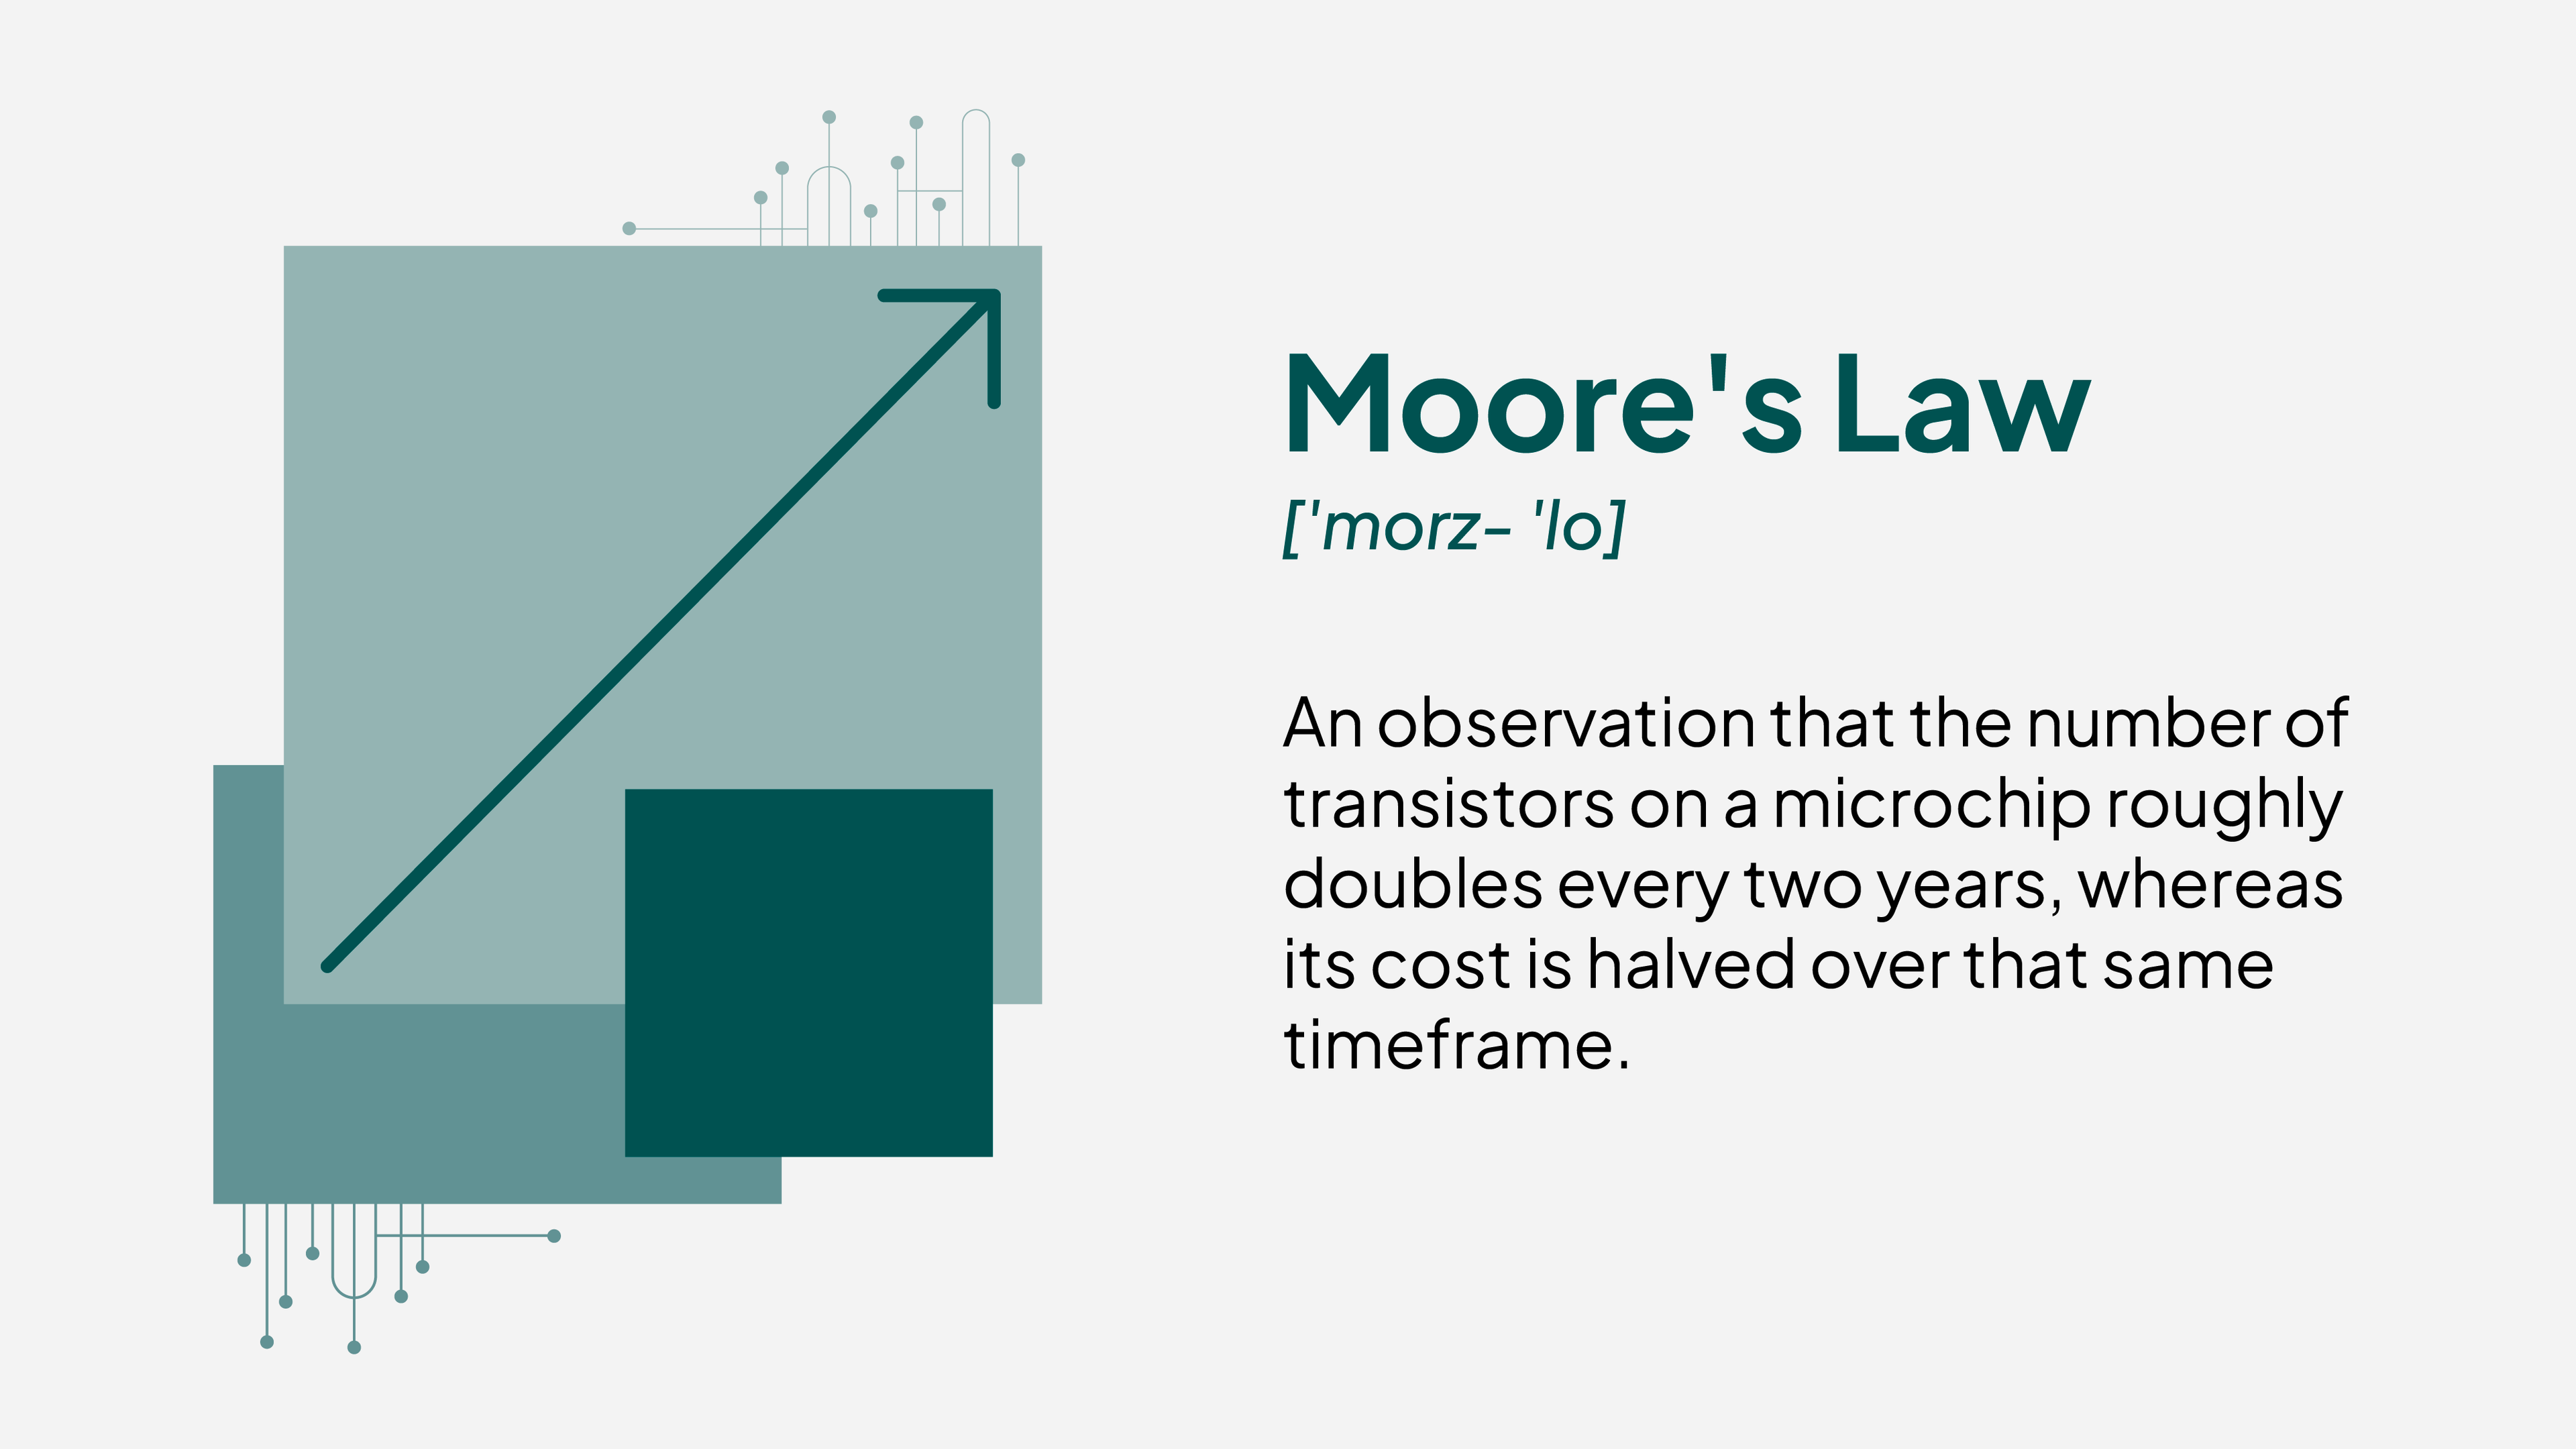
Source: Investopedia
What Polars Does
Polars is a dataframe library with front ends available in Python, Rust, and Node.js. What sets it apart from dataframe libraries like pandas is that it supports lazy and semi-lazy execution. This means that the code will only be run when you actually need the result. This saves time and is usually more efficient. By leveraging the power of Arrow, Polars has zero-copy interoperability with other tools, reducing serialization and deserialization costs. This is one of my favorite features of Polars and if you’d like to know how to get started using Apache Arrow to get the same benefits, watch my talk here.
One of the most mentioned traits about Polars is the fact that it’s fast. Since it’s built in Rust it benefits from the languages high performance, memory safety and concurrency without data races. Polars also enhances its speed by combining cache-friendly data structures with data-aware algorithms. It leverages parallelism at different levels, both within the query engine and per algorithm, making the most of your CPU’s capabilities. In terms of hardware optimization, the library uses SIMD operations, which allow for processing multiple data elements simultaneously. Its query optimizations also help minimize unnecessary work, resulting in faster execution.
When benchmarked against several other popular frameworks like pandas, DuckDB, and Vaex on the TPCH benchmark, Polars performed very well. Here’s an image of the results shared by their team here.
text
Polars (purple) AND DuckDB (orange) carry out the operations in significantly shorter times than all other frameworks. 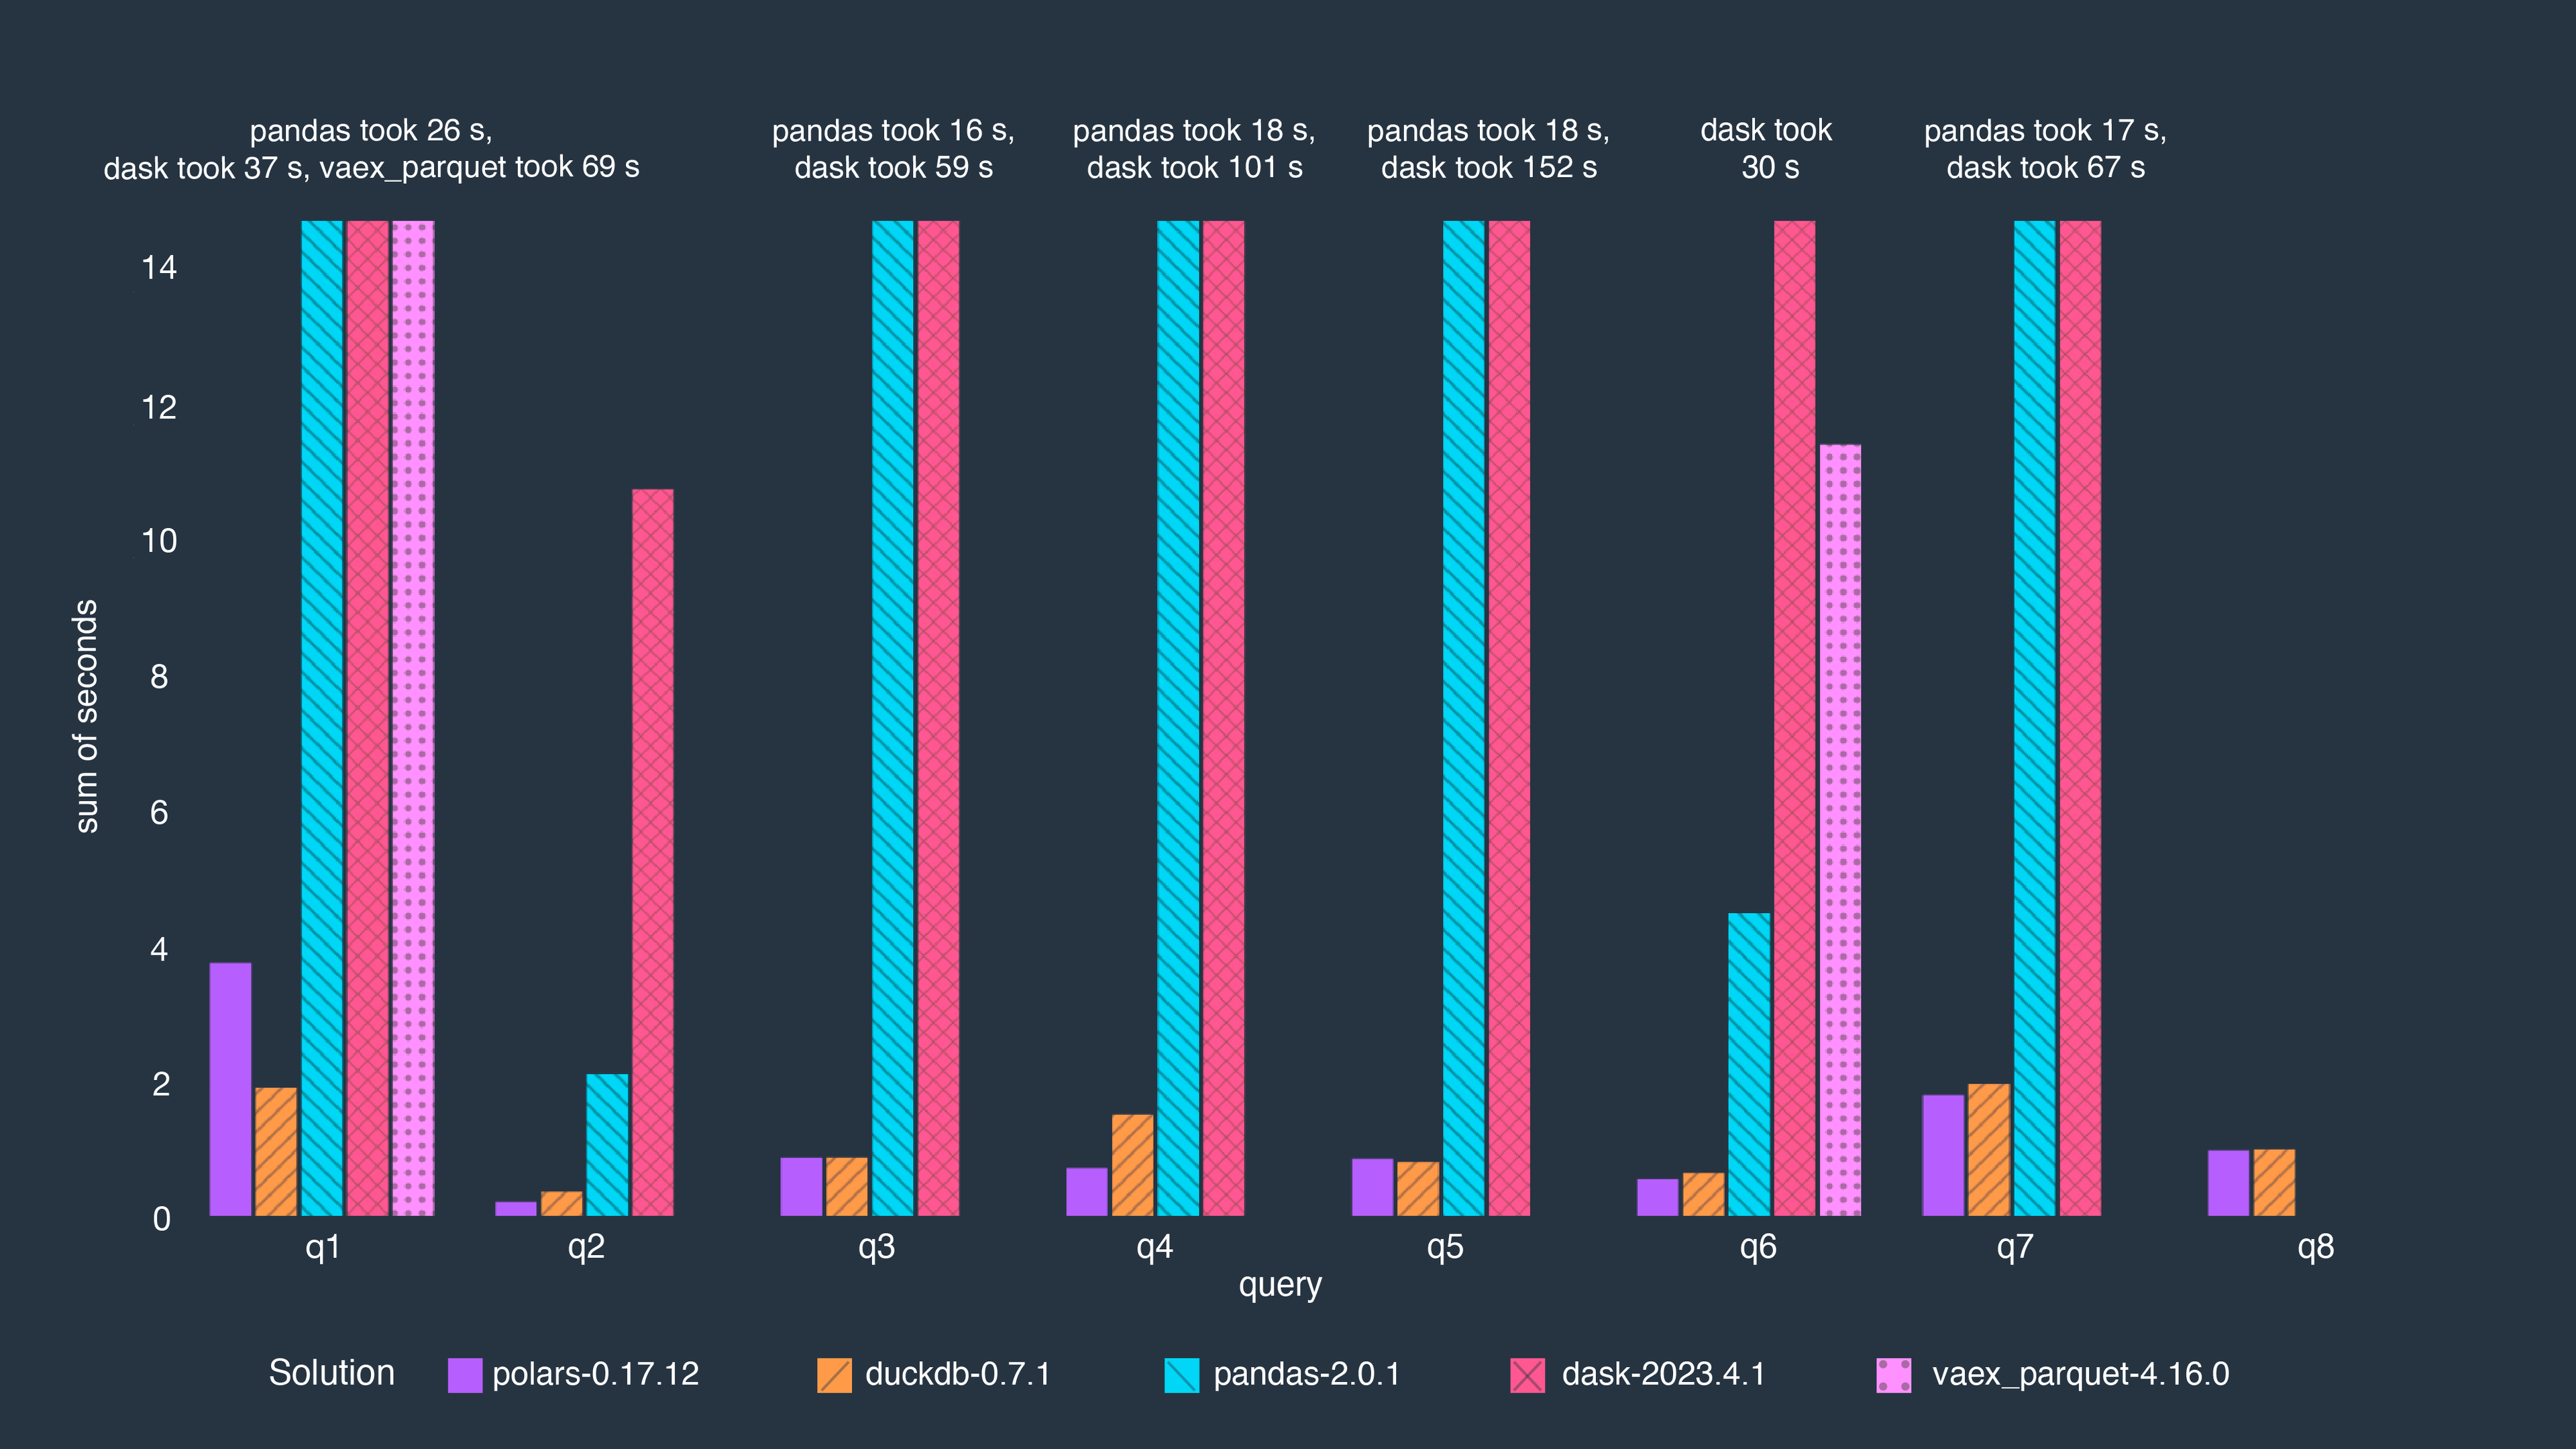
Example Code
Polars code should feel fairly intuitive, particularly to pandas users, though there are differences between the two. To illustrate the syntax and capabilities of the library, let’s look at an example. Suppose we have a dataset with columns “foo” and “bar,” and we want to sort the data based on the values in the “bar” column. In Polars, we can achieve this with the following code:
python
import polars as pl

df = pl.DataFrame({
    "foo": [1, 2, 3, 4, 5],
    "bar": [5, 4, 3, 2, 1]
})

sorted_df = df.sort("bar")
print(sorted_df)
Polars’ syntax allows us to perform data manipulations efficiently and intuitively.
Integrating Polars Into Your Data Pipeline Using Ibis
A final thing to note is that Polars is mainly intended for building data pipelines. It does not have as much functionality for data exploration in the same way pandas does. Also, as we can see from the benchmarks above, although Polars beats out the other libraries by a significant margin, DuckDB keeps up and for some queries does much better. If you’re looking to make your system as performant as possible, you need to build a modular workflow that utilizes the best tool for a task. Ibis is a Python library that empowers you to do this. Having the ability to use either DuckDB or Polars gives developers optionality - the choice to pick the best tools for the task. Embracing a strategy of augmenting current systems by building modular workflows increases productivity and accelerates results. The Ibis project really supports this. Let’s take a look at Ibis code that integrates Polars and DuckDB into one notebook.
We’ll start by using Ibis to connect to DuckDB and read a CSV file with information about movies and TV shows on Netflix. We’ll also fill in any nulls and just in case use the dropna method to ensure no data is missing.
python
# start by connecting to the polars backend
import ibis
ibis.options.interactive = True

duckcon = ibis.duckdb.connect()

titles = duckcon.read_csv('netflix_titles.csv')

titles = titles.fillna({"country": "No Data", "cast": "No Data", "director": "No Data"})
titles = titles.dropna()
Let’s do a quick groupby on the data to find how many movies and TV shows are on Netflix.
python
ratio = titles.group_by(['type']).aggregate(titles.type.count())Here’s what the table looks like.
Now let’s suppose we wanted to change the tool we are using to Polars to see this potentially speeds up our pipeline. We can change from DuckDB to Polars in 2 lines of code and we can use the exact same code we just wrote.
python
#take data from duckdb and pass it to polars
polarscon = ibis.polars.connect()
titles = polarscon.register(titles.to_pyarrow())

ratio = titles.group_by(['type']).aggregate(titles.type.count())
We get the same table as above.
When creating a prototype using the %%time command to see which backend will carry out an operation faster means you can make a more informed decision about which tool to use for specific tasks. Knowing which library to use means that your pipeline is as performant as possible.
Finally, to better visualize the outcome, you can call to_pandas on the resulting table (which is now much smaller than our initial table) to generate a pandas dataframe. Here’s what this looks like from our example.
python
#generate a pandas df for better data visualization
import matplotlib.pyplot as plt

ratio = ratio.execute()

plt.pie(type_ratio['Count(type)'], labels = type_ratio['type'])
plt.show()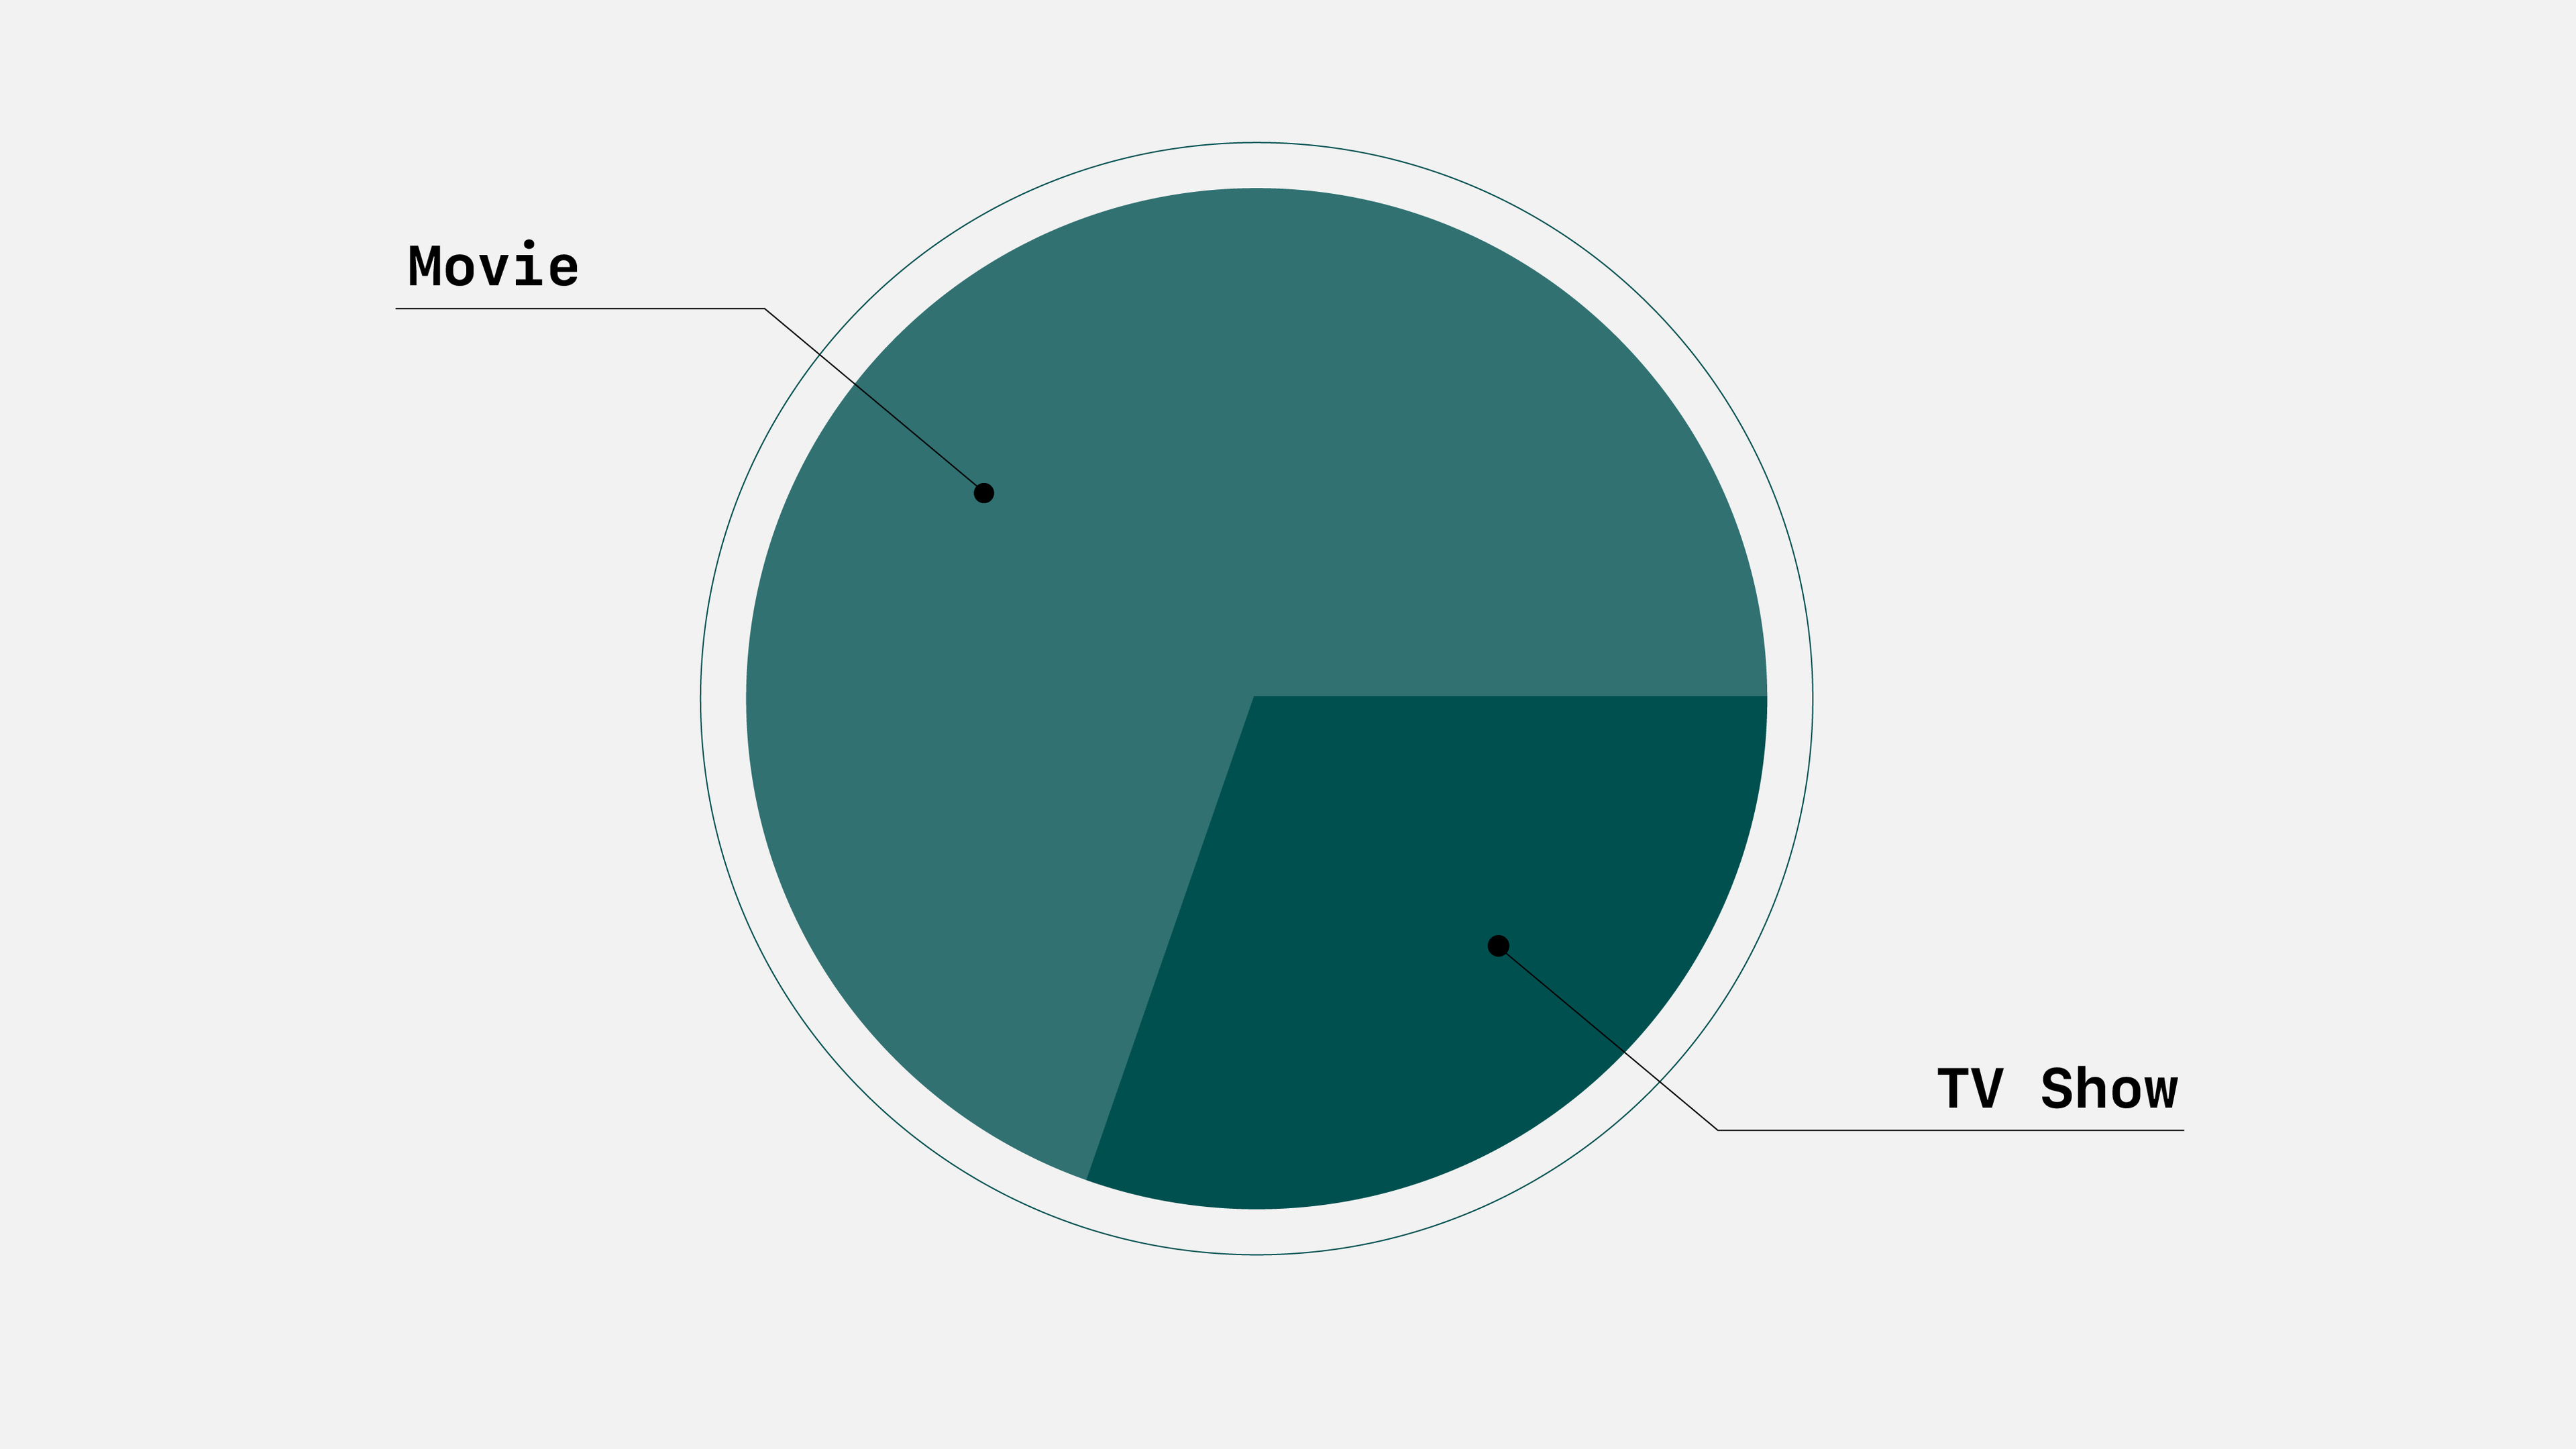
We can now more clearly see that there are more movies on Netflix compared to TV shows.
Conclusion
Adding Polars to your data pipeline presents a compelling alternative to traditional dataframe libraries, by addressing their performance limitations. With its Rust-based implementation, lazy execution model, and efficient parallelization techniques, Polars empowers data scientists to process large datasets more effectively. For those concerned about how to integrate it into existing pipelines, Ibis provides an efficient way to do so with as few code changes as possible.
As the data science world evolves, exploring innovative options like Polars is essential for maximizing productivity and efficiency. Voltron Data designs and builds composable enterprise data systems using open source tools like Ibis, Arrow, and more. If you’re interested in learning more, check out our product page.
Photo by Victoria Paar

Keep up with us