The Theseus Query Profiler Part One: The Front-End
By Johan Peltenburg,
  Joost Hoozemans,
  Matthijs Brobbeland
 Dhruv Vats
Author(s):
Published: July 1, 2025
9 min read
Theseus Query Profiler is a blazing-fast, always-on telemetry analysis tool that effortlessly visualizes distributed and GPU-accelerated query performance at scale. With a rich front-end showing both physical query plans and detailed executor timelines, it instantly pinpoints hardware bottlenecks from storage I/O to GPU memory contention. Its intuitive FSM-based instrumentation and Arrow-powered backend deliver semantically rich insights with negligible overhead, so you can optimize queries without slowing them down. Whether you’re squeezing out every millisecond of performance or simply curious how your queries execute, Theseus Query Profiler turns complex telemetry into actionable, interactive dashboards that make tuning a breeze.
This is a two-part series. This post will focus on the front-end components - the interactive visual dashboard that displays the query’s physical plan as a color-coded graph alongside detailed executor timelines, enabling users to hover, click, and immediately pinpoint performance bottlenecks across distributed GPU-accelerated tasks.
Stay tuned for the second part of the series that details the backend of the Theseus Query Planner. The back-end is built around an always-on, low-overhead distributed profiling system that captures semantically rich Finite State Machine-based telemetry via a Rust-based Monitor (using Arrow formats), delivering deep performance insights without impacting engine throughput.
What is the Theseus Query Profiler?
Theseus is a distributed query engine that runs on distributed and heterogeneous computing systems (e.g., those that have GPU accelerators). Provide it with a set of tables and a SQL query, and it will compute the result using high-throughput GPU accelerators. See our TPC-H benchmarks at scale factor 100,000.
Running large data-intensive workloads on a distributed and heterogeneous computing system is complicated. If you are looking to deeply optimize a certain workload, you are looking for a system that is balanced across the entire stack. You may be asking questions such as:
- What is the bottleneck in the system?
- Is it a hardware bottleneck? Is my accelerator I/O bandwidth saturated? Should I add more GPUs? Or get faster storage? Or improve my network infrastructure?
- Are there any software knobs I can tune?
- Could I rewrite my query to help the query planner perform certain optimizations?
In this blog post, we will introduce a tool that comes with Theseus called the Theseus Query Profiler. It’s an always-on query engine telemetry analysis tool that has negligible overhead. It is distributed and scalable, supports heterogeneous compute, and allows our users and engine developers to quickly analyze the performance of executed queries to help fine-tune infrastructure, software configuration, and queries running on the Theseus engine. Theseus Query Profiler uses Apache Arrow, ensuring high performance and composability.
The Theseus Query Profiler Front-end
Before discussing the entire stack in more detail, let’s look at the type of insights users can expect. Below is a typical view of the Theseus Query Profiler.
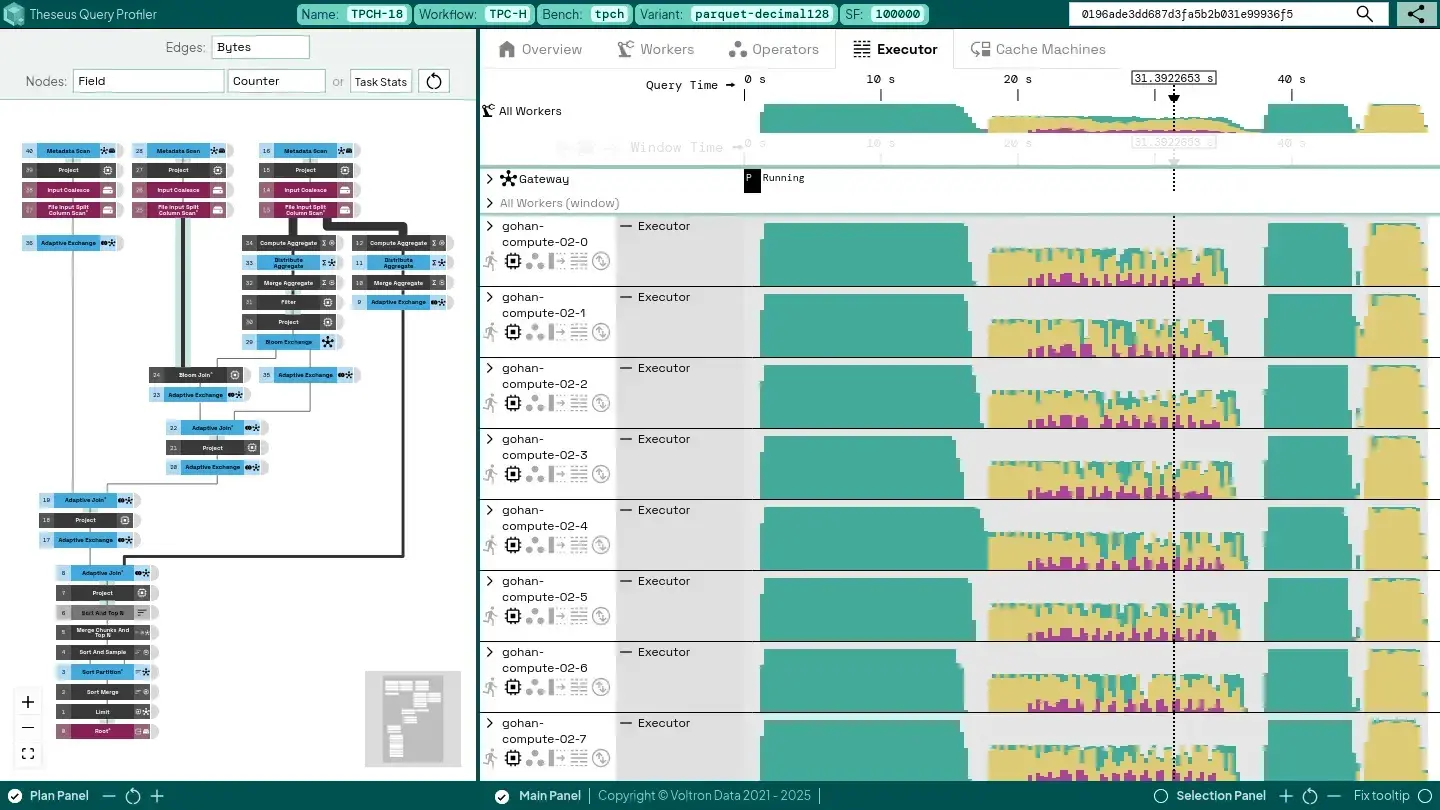
Physical Plan
The left-hand graph lays out the query’s physical plan, where each node is an operator and each connecting edge shows how data flows between them. Operators are color (and icon-coded) to highlight their roles: blue nodes require cluster-wide communication, red nodes perform storage I/O, and black nodes handle local compute (or memory-intensive work), all rendered in a colorblind-friendly palette. This clear visual mapping makes it easy to scan complex plans and instantly spot where expensive operations occur.
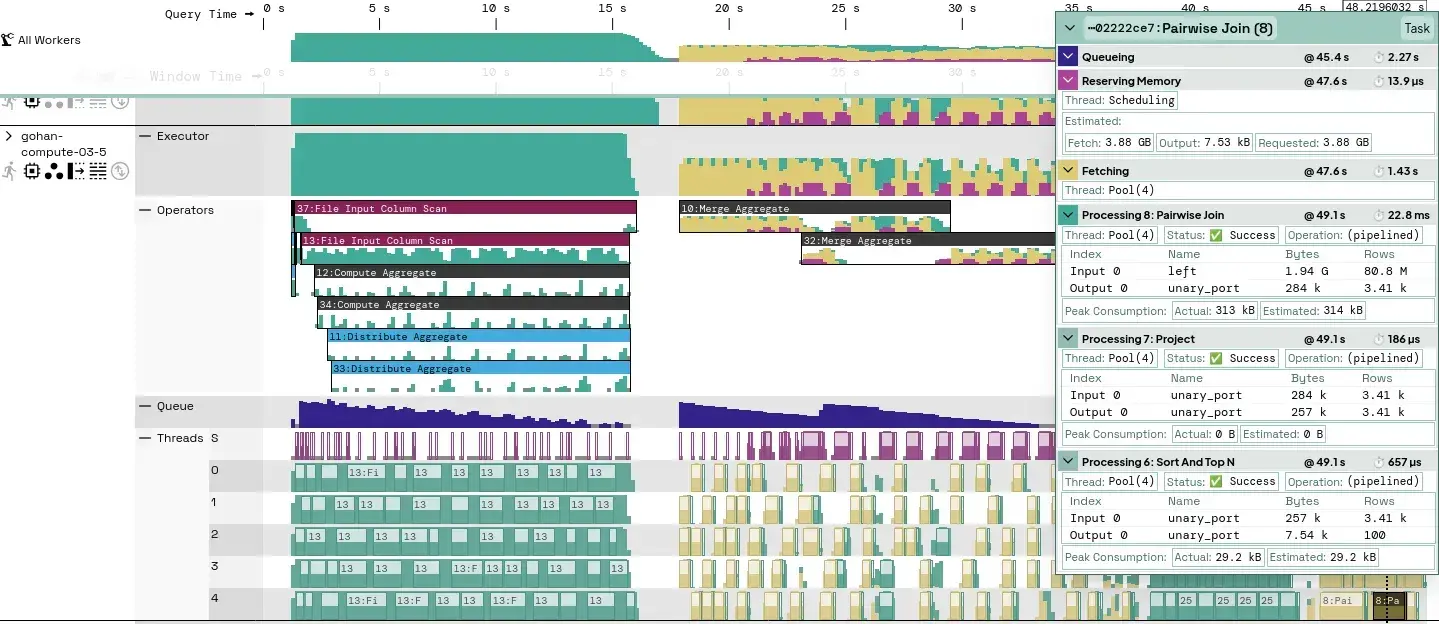
Hovering provides more detail. For example, if we hover over one of the operators, we see the following:
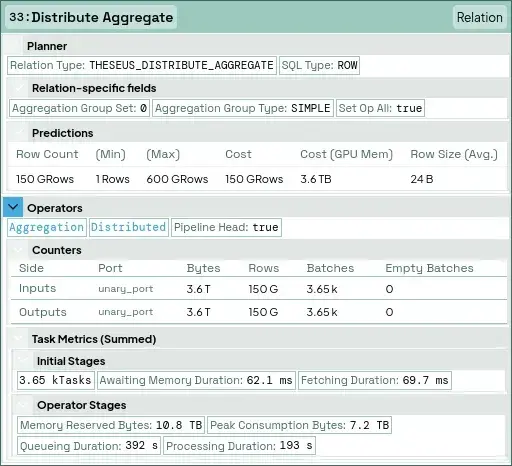
This is the Distribute Aggregate operator. It distributes the result of an aggregation that is local to a single worker to all other workers with high-level statistics about how this was executed.
Each operator processes the same amount of data in bytes, rows, and batches because it distributes rather than transforms across thousands of parallel tasks. The engine spends almost no time waiting for GPU memory (62.1 ms) or moving data to the GPU (69.7 ms), so what you’re seeing is control overhead. If you click on any node, the selection panel will reveal even deeper insights (not shown here).
Any metric can be used to highlight components in the physical plan. For example, let’s highlight the amount of bytes sent directly from GPU memory (using UCX) to other workers in our cluster:
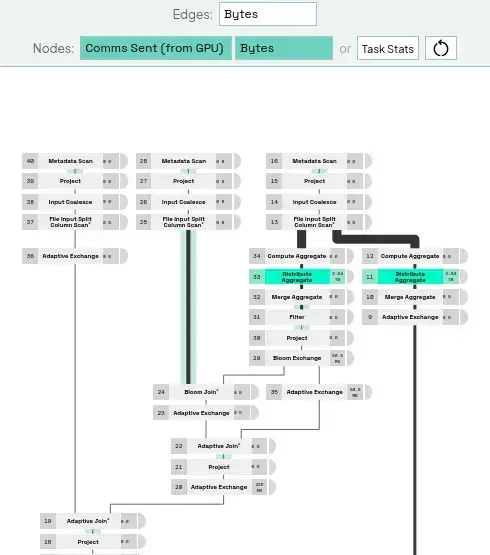
This view helps users easily relate specific metrics to a physical plan operator, which can quickly focus optimization efforts.
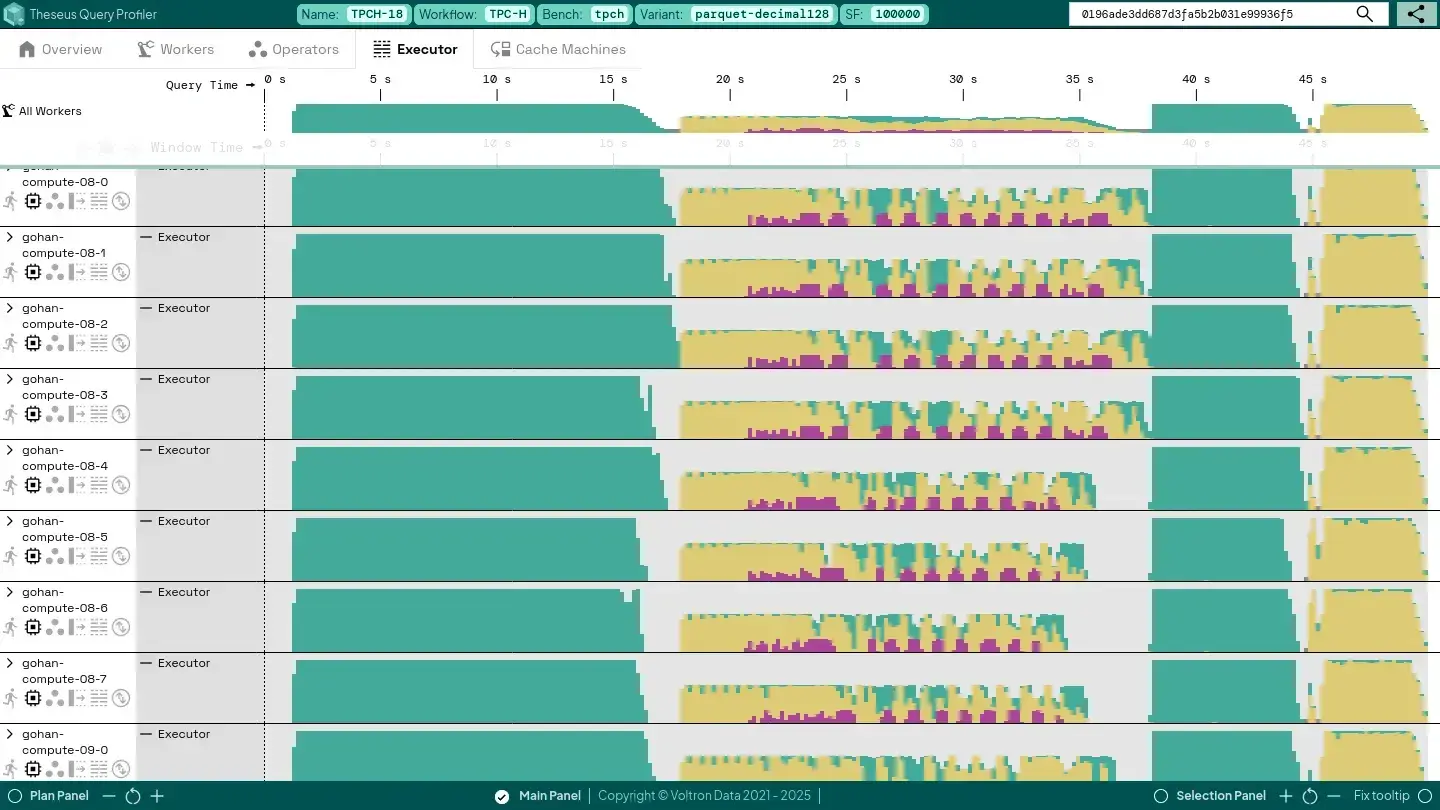
Executor View
The binned timeline on the right breaks down how long Theseus’ asynchronous tasks spend on each type of work across all executor threads. Green bars show data processing time, yellow indicates data movement (e.g., host to GPU memory), and purple marks waiting for device memory. You can hover over any bin to see details. Because this sums time per thread, percentages can exceed 100% when work overlaps concurrently (unless tasks are stalled by external resources like the network or other workers).
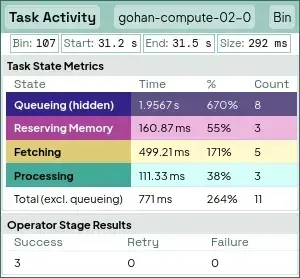
Clicking the icons under each worker reveals even more detail. For example, expanding the “Operators” view displays per-operator task activity, while the “Batches” view shows where intermediate query results are stored and how quickly they move through Theseus’s control layers.
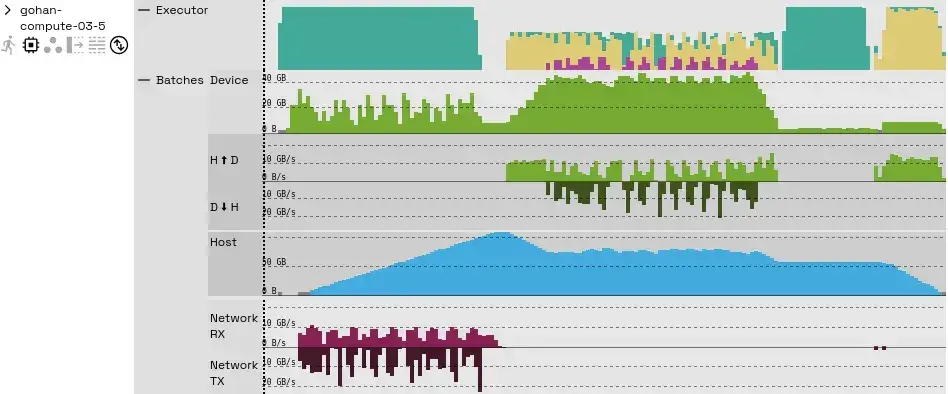
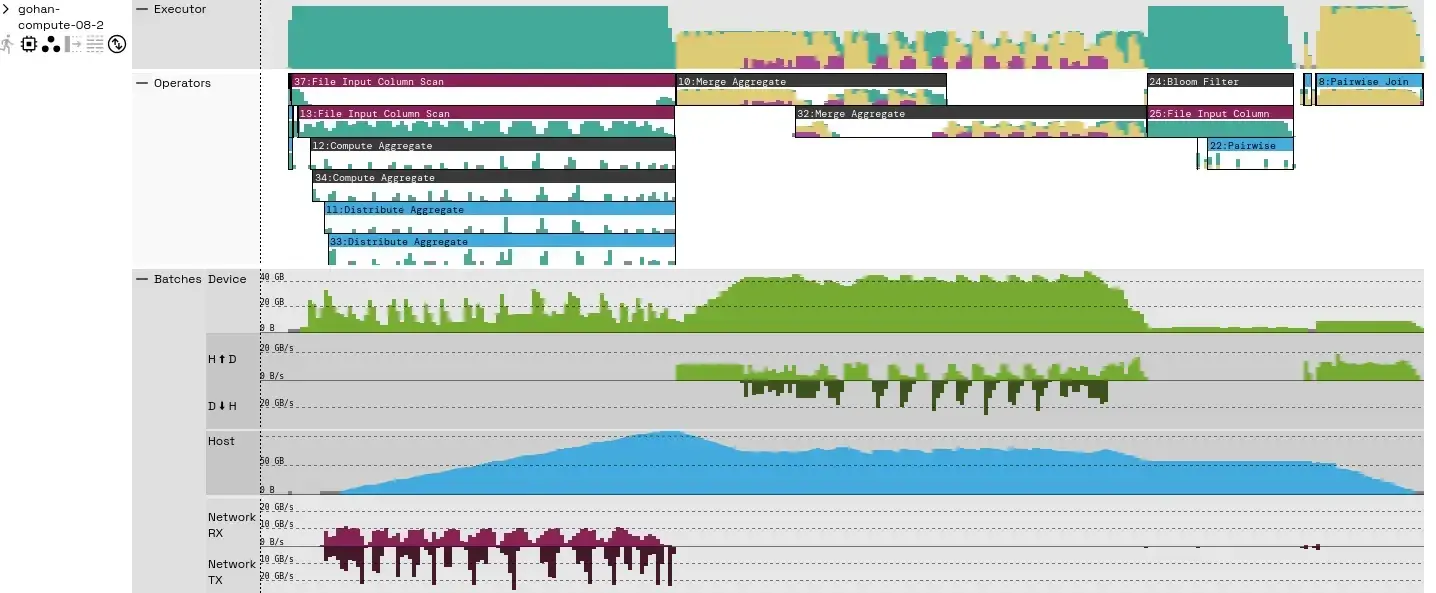
The “Batches” timeline shows how much device memory each batch uses, the transfer rates between host and device memory (and back), host memory occupancy, and network bandwidth. Since this query doesn’t spill any intermediate results to storage, spill-related graphs aren’t shown—if it did, you’d see additional occupancy and throughput rows for those spills.
There are several other timelines, shown below:
Here we can also see:
- Time spent by the executor per operator.
- Tasks waiting in the queue, ready to be picked up by the executor.
- Activity in specific threads of the executor thread pool.
- Individual tasks that can be highlighted if they are significantly large at the current zoom level. We’ve highlighted one of such tasks near the end of the query.
Example Query Optimization Exercise
These interactive views let you drill into your query’s execution and quickly spotlight any performance bottlenecks. In the example below, we’ll highlight key insights, like hotspots in data movement or memory contention that point to easy wins.
Worker Balance
One thing we observe is a slight imbalance in when workers reach certain synchronization points. This can have a very large number of reasons, but if we were to fix this, we could make this query a few seconds faster. Not too interesting, unless you’re trying to squeeze out the last bit of performance.
File I/O
In the first section of the query, we’re (obviously) mainly involved with file scanning. The tasks working on this show a lot of “green” (a.k.a. they are simply processing their inputs). We could continue our investigation with the following angles:
- If we’re bottlenecked on storage I/O, we could try to increase the compression ratio of our input files to trade off compute in order to gain higher uncompressed bandwidth, or we could buy a faster storage infrastructure.
If we’re bottlenecked on file decompression, we could try to use a more GPU-friendly compression algorithm for our input files, or we could increase the number of GPUs we use, or we could increase the number of executor threads (but be aware, the time tasks spend processing on these threads typically involves just orchestrating the GPU computations, so if the compute device is already saturated, this may not help, see future work).
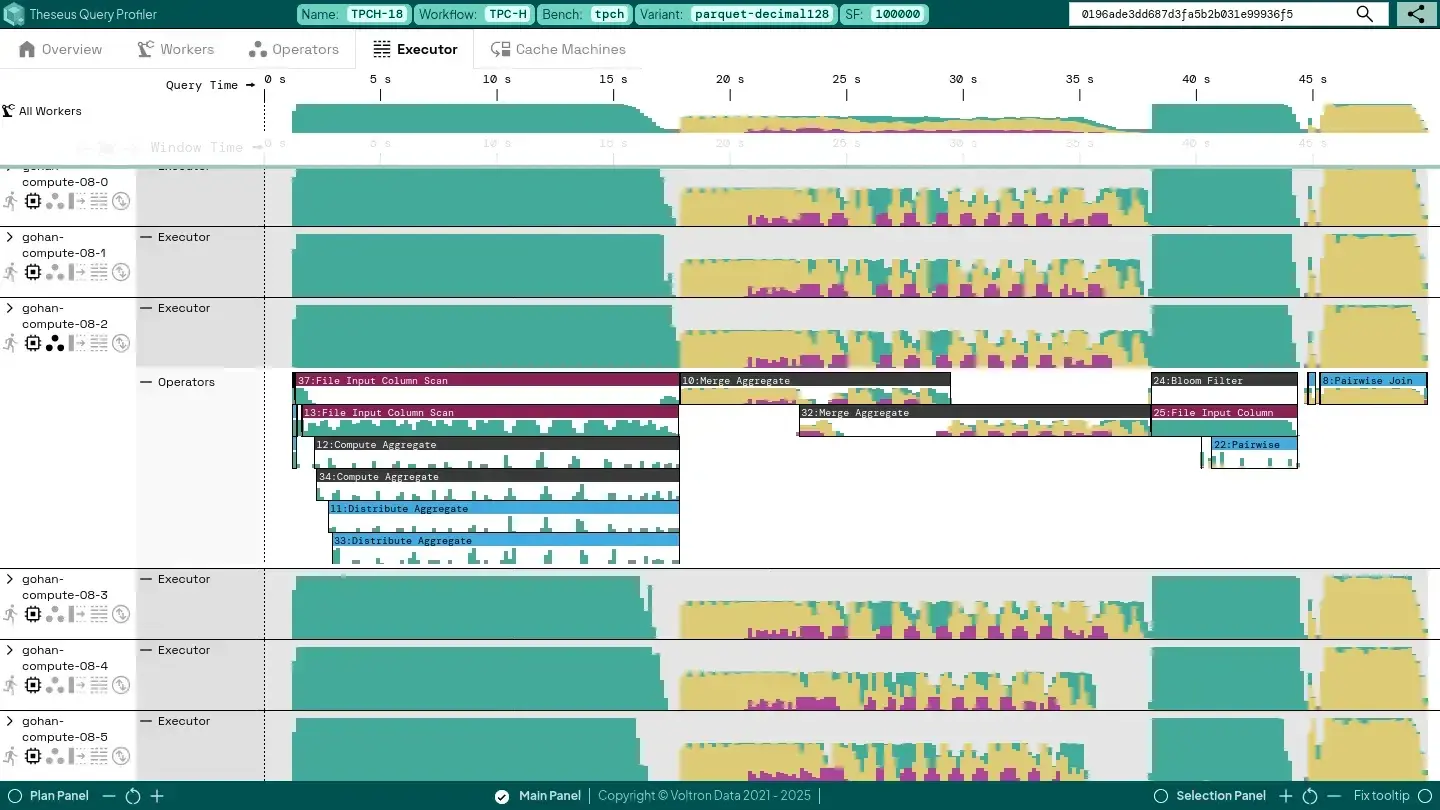
Device Memory Capacity and Host-to-Device / Device-to-Host Throughput
During the middle part of the query, where we’re performing the “Merge Aggregate” operations, we can see that we are spending quite some time spilling data from and fetching data to GPU memory (the yellow bits) as our device memory consumption grows beyond our configured limit (the green “Device” row).
It also looks like we’re not yet achieving the kind of bandwidth that we could expect from a PCIe Gen 4 x16 interface used in our system, which can theoretically go near 32 GB/s in each direction (see the green “H - D” and “D - H” graphs). We’re only achieving about half of that at most. We could investigate:
- Raising the configured device memory consumption limits for our intermediate results, at the risk of running out of memory more often (this is not fatal, but may slow down the query).
- Better configure the batch sizes that both the “Distribute Aggregate” and “Merge Aggregate” operators emit, because that may result in longer bursts (and more efficient utilization) over the PCIe interface. However, this has to be traded off against the potential overhead of performing the resizing of intermediate batches.
- Enable Theseus’ compression feature of batches that move over this interface in order to trade off GPU compute against higher effective bandwidth.
This could be a case where it is worthwhile for our engine developers to grab for tools that go deeper, such as NSight Systems, to further inspect what exactly is happening in and around the GPU. This shows how Theseus Query Profiler complements other tools that we will discuss in the next part of this blog, even if it is just by simply filtering out which cases really need such deep digging.
Wrap Up
These are just some ways of how you can analyze query performance with the Theseus Query Profiler, especially if you’re looking to squeeze out the last bit of performance. Stay tuned for the second part of the series, where we discuss the internal backend of the Theseus Query Planner. Learn more about how the backend is built around an always-on, low-overhead distributed profiling system that captures semantically rich Finite State Machine-based telemetry via a Rust-based Monitor (using Arrow formats), delivering deep performance insights without impacting engine throughput. To learn more about the Theseus Query Profiler, head here - https://voltrondata.com/query-profiler.

Keep up with us