The Theseus Query Profiler Part Two: The Backend
By Johan Peltenburg,
  Joost Hoozemans,
  Matthijs Brobbeland
 Dhruv Vats
Author(s):
Published: August 26, 2025
18 min read
This post is the second post in a series covering the Theseus Query Profiler. For an introduction, we invite you to look at the back-end of the Query Profiler introduced in the previous blog post. This post will cover the profiler’s internals.
Profiling & Observability
Profiling a distributed query engine on heterogeneous hardware is incredibly difficult with existing tools. Even on a single node, CPU profilers like Linux perf, Intel VTune, and AMD μProf and GPU profilers such as NVIDIA Nsight Systems, AMD ROCm Systems Profiler, or Intel Advisor provide insight in isolation, making sure that the code that moves from A -> B performantly during the early phases of development. However, when you want to see how that code operates inside a complex distributed parallel system, then the Theseus Query Profiler is the right tool for the job. Theseus exposes its outer layers via OpenTelemetry to trace everything from a client SQL request down to distributed components like Arrow Flight.
Why build the Query Profiler?
Our engineering teams frequently hit hurdles when chasing down performance metrics. There is a gap between how engineers think and talk about code performance and what is offered by these tools. Before we built the query profiler several years ago, a typical conversation could have gone something along the lines of this made-up example:
Engineer A: “How much throughput did <important high-level software abstraction> achieve during time span X on behalf of operator Y?”
Engineer B: “I’m not sure, let me check the logs.”
Engineer B (several minutes later): “Oh, there were some changes yesterday, my script to analyze this doesn’t work anymore, I’ll fix it later today.”
Engineer A: “Could we run it again with <insert statistical profiling tool>?”
Engineer B: “Yes, but we wouldn’t be able to see why <insert our high-level software abstraction> started doing this, we’ll only be able to see samples of <insert some low-level library doing the underlying work> running on the async executor. We can’t immediately see which operator pushed the task into the queue.”
Engineer A: “Don’t we trace this with OTel?”
Engineer B: “We’ve instrumented it, but the tracer is off by default. If we enable it, the visualization tool can’t deal with the volume for this scale factor; it just hangs.”
Engineer A: “What about the GPU device memory utilization of <important high-level software abstraction>?”
Engineer B: “Good idea, but we’d need to trace that with a different tool.”
Criteria for the new profiling system
To replace speculation and script-breaking delays with data-driven, actionable insights, our criteria for the new profiling system include:
- Runs continuously (always on)
- Is distributed and scalable
- Has negligible impact on query performance
- Provides instrumentation options that make sense for:
- Data-intensive workloads
- Heterogeneous computing systems (e.g. ones with GPUs)
- Talks like us, and quickly shows us things that we can change
- Allows us to observe live query progress
We still reach for perf, VTune, Nsight, OpenTelemetry, etc., when they fit the bill. Our engineering teams talk a lot about the performance of our query engine in Voltron Data. If you listen in on these conversations with the tools described above in mind, you will notice there is a certain gap between how engineers think and talk about code performance and what is offered by these tools.
When statistical profilers sample the call stack of a code base that is changing quickly, it becomes very hard to maintain automated analysis tooling that ingest stack traces and translates them into actionable insights. Tracing why something happens rather than when and how often is also hard due to the highly asynchronous nature of our engine. Sampling-based profiling may skip over a certain state that is needed to produce a complete picture (e.g. the total number of bytes processed by a certain operation that is data-dependent). There would also be many samples that we simply don’t care about, increasing the time required to analyze and the cost of storing the profiling data. Furthermore, these types of profiling tools are typically focused on computationally intensive tasks, and they’re also good at exposing control-flow bottlenecks, but they don’t provide great insight into systems running data-intensive workloads on accelerators. For these workloads, it is not only important to observe the state of our memory and I/O resources, but we also need to be able to relate why these resources are in that state in order to improve the algorithms that utilize them. We need to know how and why the data moved across the system, as many bottlenecks are due to unnecessary data movement.
We often use NSight Systems to optimize GPU kernels and our systems software interaction with the GPU, but it does incur measurable run-time overhead, which doesn’t work with always-on profiling. Plus, it doesn’t officially support running for longer than 5 minutes, while real workloads can often run for hours or even days.
At the other extreme, instrumenting the code with something like OpenTelemetry at the granularity we need (e.g., to trace data movement across hardware interfaces) is often too verbose and produces data too excessive for typical tools in the ecosystem to handle efficiently. If you go deep enough, there is quite a lot of overhead associated with using its APIs that require you to define your data model at run-time. It also gets expensive when you’re being charged per span or ingested byte, as many companies providing analysis tools in that ecosystem do.
Furthermore, while there are many good telemetry dashboards out there, we found they don’t ultimately provide visualization options that match our mental run-time model of the engine (how we think and talk about Theseus). This would have required us to build data visualization solutions in these vendor-specific tools, which would require others to use these same tools if they wanted to benefit from the same insights. So while the upper layers of Theseus are still traced with OpenTelemetry (where different distributed services in the cluster interact), for the depth of the type of performance analysis we want to do, it wasn’t a great match.
As we worked around these issues, the query profiler initially emerged as a set of relatively simple internal engineering tools, but as we built it out, trying to tick off the requirements described above, it started growing into something that was positively received by our developers. It had a noticeable positive impact on the performance of Theseus itself, and it was helping to more quickly gain more engine performance. It reduced the amount of speculation about performance in our conversations. Also, our customers started showing interest. We decided to take all that we learned and rebuild the tool from the ground up.
Modeling engine behavior
Our design was guided by conversations with developers and users about how they conceptualize Theseus’ engine components. We talked with the developers about their mental model of the engine and took the time to understand how they want to perceive the runtime behavior. This resulted in basing the telemetry concept on a set of uniquely identifiable entities modeled as Finite State Machines (FSMs). This may not be surprising, since FSMs are foundational models for both hardware and software systems. The result is that Theseus now has a relatively simple yet elegant monitoring subsystem (written in Rust) that can be seen as an advanced form of structured logging with strict and verified Finite State Machine (FSM) semantics. This subsystem is called the Monitor.
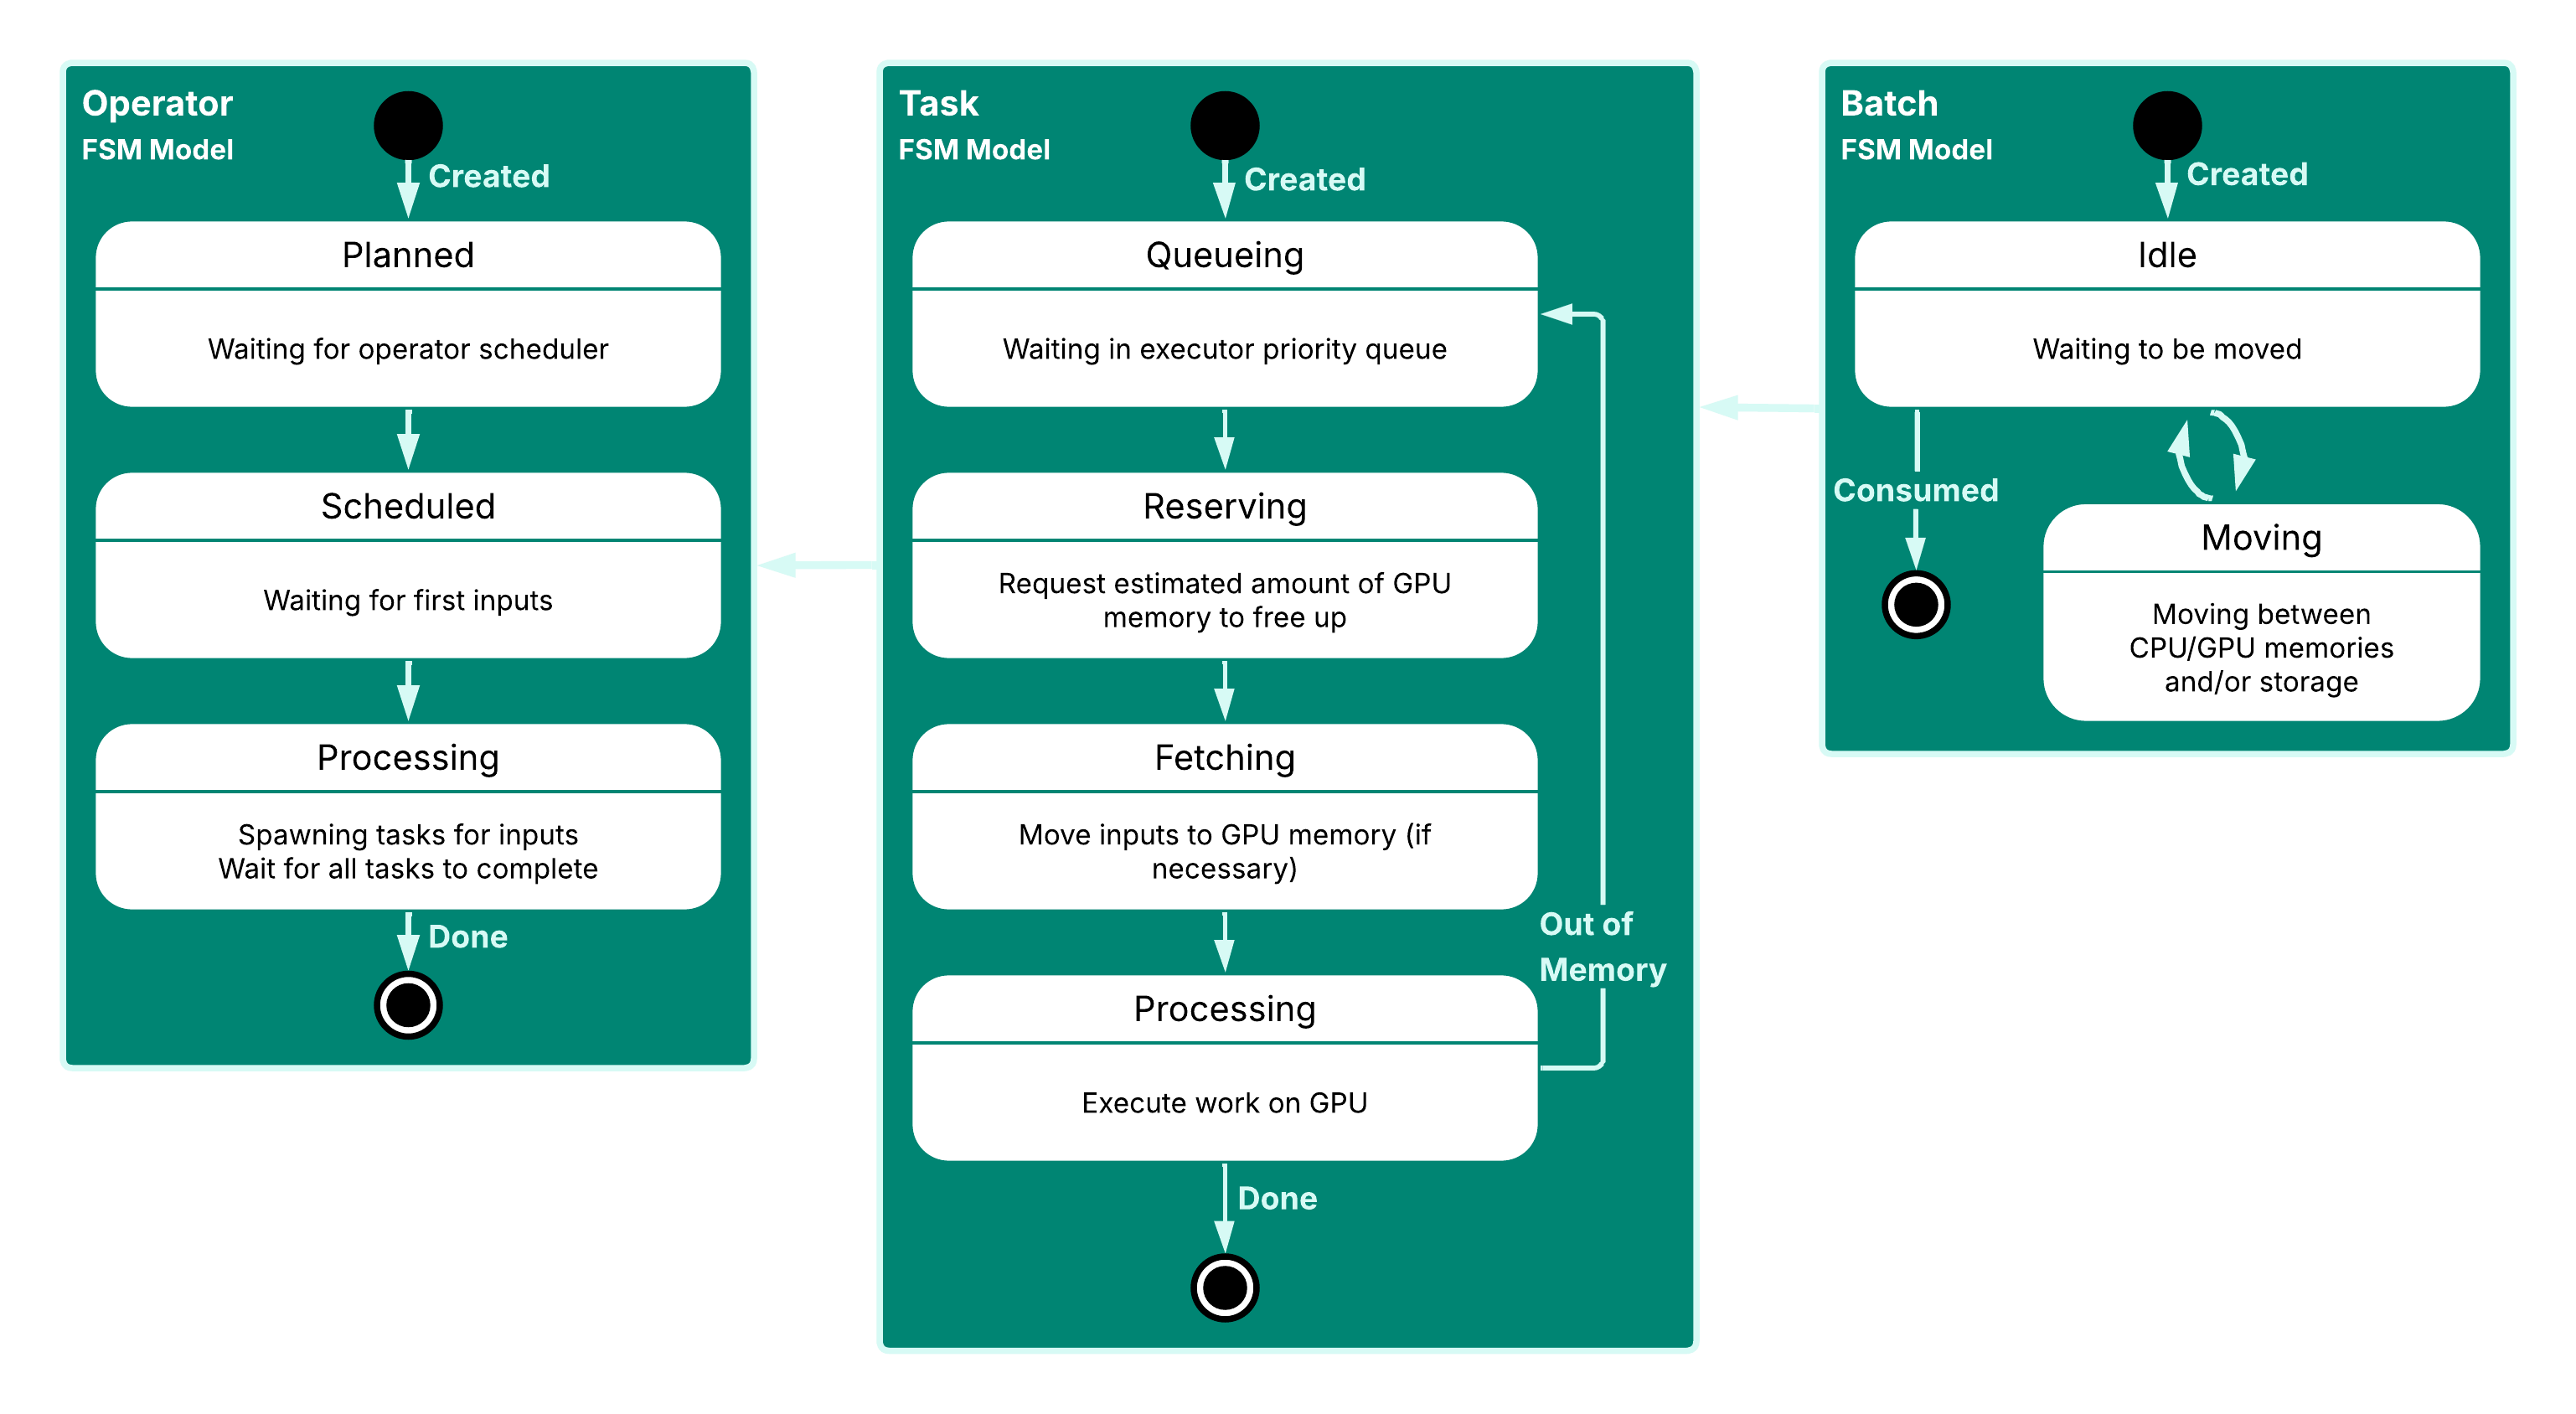
To make this more tangible, we’ll go through a simplified example of how we use the Monitor and its FSM-based instrumentation strategy in Theseus. Consider a common software abstraction found in query engines - an operator in a physical query plan. As Theseus executes the physical plan, an operator goes through various states during its lifetime, depicted in the figure above on the left-hand side.
- It is first created with some constant properties as a part of a directed acyclic graph representing the physical plan.
- Then, under certain conditions, it gets scheduled to run, waiting for inputs to arrive.
- Next, it starts spawning tasks, which are handed off to the asynchronous task executor.
- When all tasks are finished, the operator is done, reaching its final state.
During each state of the operator, we track relevant metrics (e.g., number of bytes processed). During each transition, we capture the conditions and metrics in an event.
The aforementioned tasks that are spawned by the operator are also modeled as an FSM (which is shown in the middle of the figure above). When spawning a task, an initial event is fired that refers to the unique identifier of the operator that spawned it. This way, we can properly tie the operator and tasks together in post-processing and analysis. A task goes through several states; it first sits in the queue of the executor, then reserves memory, then fetches inputs, and finally processes its inputs. It can return to the queueing state because during processing, it may run out of memory, and get retried with a larger memory reservation. This is the type of dynamic behavior that is excellently captured by an FSM-based model of this task. It allows us to easily answer questions such as “How long was this task queueing?”, which would be a lot less trivial from looking at the stack trace of our queue implementation.
Inputs for tasks are called “batches” in the engines (short for record batches, which are slices of the total data processed by an operator). These too are modeled by a relatively simple FSM shown on the right hand side of the figure above. For their initial event, the batch model will capture the identifier of the task they are being owned by. The engine is able to move these batches between memories and/or storage, e.g. to spill them from GPU memory to CPU memory or to load them from storage to GPU memory, so the FSM is simple. After the creation of a batch it is either idle or being moved, until it is finally consumed by a task.
These are just a few small and simplified examples of models of components tracked by the Monitor. While you could capture all this information in a more trivial way, with say, logs, a great advantage of using these FSM models is that the Monitor validates the sequence of FSM state transition events at run-time, such that downstream analysis can trust that the telemetry it receives is properly formed. It is also an additional layer of validation that the engine behaves as expected, and it has exposed several logic bugs as a result.
The way entities modeled as FSMs can relate to each other is somewhat similar to how, for example, OpenTelemetry spans can relate to their parent span in a trace, but unlike with traces, we’re not restricted to form a tree, which makes instrumentation and analysis much easier. We can construct arbitrary graphs of entities modeled as FSMs connected in a way that makes more sense than through a trace following the call stack. Again, this is how we think and talk about Theseus.
An interesting side note is that spans of a trace can actually be modeled as FSMs themselves. This also allows us to fine-tune certain restrictions, which allows us to best fit the model to the execution mechanism of the engine, and simplify downstream analysis. For example, in an asynchronous execution scenario where tasks hand back control to a scheduler, a span tracing the execution of the task can be defined as an FSM that transitions from being in an active state to an inactive state multiple times. On the other hand, if we’re tracing a synchronous function, we don’t want to allow this, so we don’t have to check for multiple entries in downstream analysis. Allowing a span to be entered and exited and re-entered is something supported e.g. by the Rust tracing crate, but this is not allowed in OpenTelemetry’s definition of spans. Thus, wherever we want a trace of spans to model the execution of the engine in either way, we can still do so without the loss of generalizing our instrumentation with FSM semantics.
Instrumenting the engine
The Theseus engine code creates FSM state transition events through the Monitor’s API. For the bulk profiling data, when subsequent transitions correctly follow the rules of the model of our engine, the data is exported. (For the live progress feature, there is an additional path that doesn’t require the FSMs to be complete. This allows the Monitor to turn state transition events into a stream with query progress updates without having to wait for the entire query to complete.) If a sequence of state transition events doesn’t adhere to the model, our developers are notified. In production builds, unforeseen incorrect use of the Monitor will never cause a query itself to fail - it is a pure sink to the engine.
Depending on a configurable level of profiling detail, the data could become relatively large, and may scale linearly with the input size of a query. In order to make this scale without problems, we allow exporting the event data in a completely decentralized manner.
The Monitor uses Arrow as its in-memory format, which makes it easy to connect it to all sorts of storage systems. For our internal on-prem benchmarks, we write the data as Parquet files to a high-performance distributed storage system, and for cloud benchmarks on AWS to S3. One initial drawback of completely decentralizing data acquisition is that it would be costly to figure out, from the bulk of data across a large number of queries, which exported data is relevant for the performance analysis of one specific query. We’d basically need to find one query needle in a haystack of all previously stored data.
In order to solve this issue, the Monitor has a very lightweight and optional metadata path to a centralized service that fills a database with query history. Each Monitor has its own unique identifier as well, which it sends to this service, alongside the unique identifier of the query it received events for. This way, downstream analysis tools can ask this query history service which Monitors were involved in tracking a specific query. This allows these tools to quickly narrow down on the data only relevant for the query they are analyzing.
Since we’re all about advancing the Arrow ecosystem as well, we did a cool side project that deserves a lot of credit. It is a new Arrow library specifically meant for applications with schemas known at compile time, called Narrow. The problem it tries to solve is that the official arrow-rs API is (understandably) designed for working with Arrow data of which the schemas are not known at compile time (e.g. in query engines like DataFusion). When using this API, you’ll find yourself spending quite some time debugging schema/type-related errors at run-time (which isn’t the typical strongly-typed Rust experience), and we are using Arrow across the entire stack, starting with the Monitor. Since our engine model is known at compile-time, the schemas of the Arrow data capturing the events are also known at compile time. With Narrow you can define Arrow schemas as plain Rust types, and it automatically derives all the necessary functionality to convert between Rust’s row-oriented in-memory representation to Arrow’s columnar in-memory representation, and vice-versa.
Hence, Narrow helps us easily maintain and quickly expand the code of the Monitor, but also of the downstream analysis pipeline. It also helps us be very efficient, as we don’t have to waste cycles, memory or storage on using instrumentation APIs in which your data model has to be defined at run-time. We’ll talk a bit more about the technical details of Narrow in an upcoming blog post, but if you already want to check out, see its GitHub repository; stay tuned!.
Turning profiling data into actionable insights
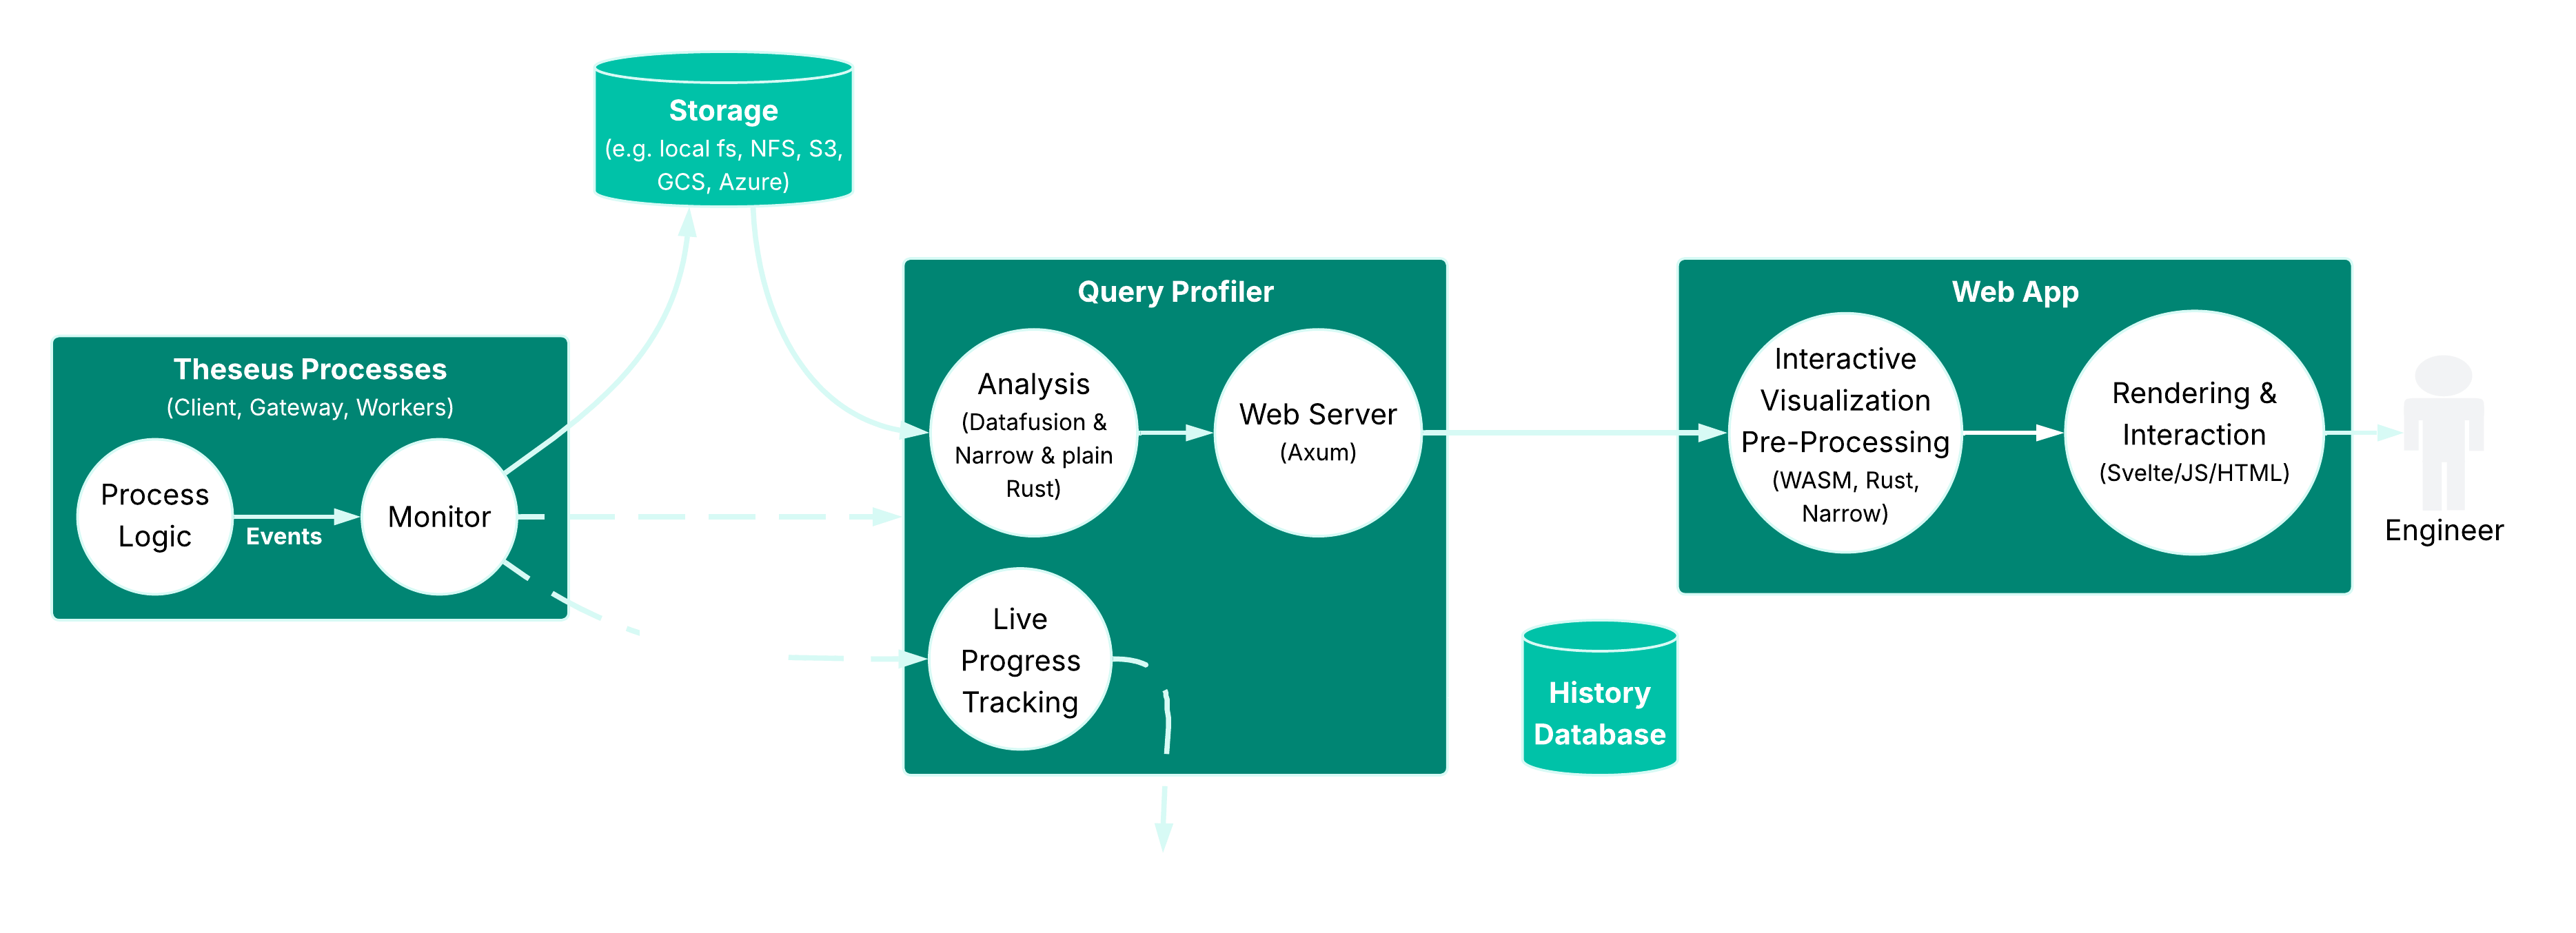
Anything that speaks Arrow can ingest data from the Monitor, so our users and developers can analyze it with e.g. an Ibis notebook, if they want to. We’ve built the Query Profiler executable (also written in Rust) to cover the majority of the use cases related to performance analytics.
The Query Profiler executable provides a number of features based on the Theseus Monitor data including:
- It serves various performance analysis features through HTTP endpoints, which makes it easy to hook up to other types of dashboards if desired.
- It serves the interactive front-end as a static webpage described in the first version of this blog that uses these endpoints.
- It aggregates progress of queries from multiple monitors while they are running, which is used in the Theseus Control Plane to give users live updates about query progress.
- If needed, it can recover the entire History database from decentralized event data alone.
Focusing on the UI-based flow, when users interact with the Query Profiler application and hit one of the HTTP endpoints, Quenta loads and processes the Monitor data using DataFusion. We’ve chosen DataFusion because the data we collect is compact enough (even for e.g. TPC-H or TPC-DS queries running at scale factor 100k on 64 workers) to be processed on a laptop at a comfortable latency, even when enabling the deepest level of profiling granularity, so we don’t have to use Theseus itself to analyze it, (yet 😉). Depending on the specific type of queries used in analysis, DataFusion does almost everything, but some more complicated types of analyses use a custom plain Rust code path (also leveraging Narrow) after some initial joins and filters orchestrated by DataFusion. The result is often a tabular type of data as well, which is then serialized (leveraging Narrow) as a compressed Arrow IPC message, and sent back to the UI.
The UI is a thin layer over a relatively large WebAssembly component (also written in Rust) that decompresses the Arrow IPC message, and then (leveraging Narrow again) performs some final post-processing of the analysis output. This is typically not too computationally intensive, yet provides the means to interact with the data in a highly interactive manner (e.g. looking up a single row from a table with details on a physical plan operator, when hovering over it).
As you can see, it is Arrow all the way from the deepest crevices of the engine up to the fingertips of our developers and users. We are implementing the many layers of this profiling data analysis pipeline confidently backed by the excellent composability provided by the Arrow ecosystem.
What’s next?
We’re always looking for ways to expose more actionable insights to our developers and users without slowing the engine down. We drive this forward based on where we think there are still blind spots about our current bottlenecks. Engineering focus must be backed by measurements, not just intuition.
We’re going to generalize and abstract over vendor-specific libraries that allow us to dive deeper into what our accelerators are doing. This is where lower-level profiling libraries such as NVIDIA’s CUPTI and ROCm’s ROC-tracer are especially valuable.
On the other end of the engine all this profiling data is incredibly valuable for query planning, as well as providing other execution mechanisms with feedback about decisions (e.g. in task scheduling). We are investigating how we can close the loop in order to make well-informed run-time decisions on how to execute queries even faster.
Improving the performance of heterogeneous distributed query engines remains challenging, but with the Query Profiler, we've made it more accessible, complete, and faster. By intuitively modeling engine components and leveraging the power of Arrow throughout the stack, we've created a robust toolchain that helps developers and users understand and optimize query performance. Whether you're debugging performance regressions, squeezing out the last bit of performance for your queries, or just interested in understanding how your queries execute, the Query Profiler quickly and easily provides the insights you need.
Previous Article

Keep up with us